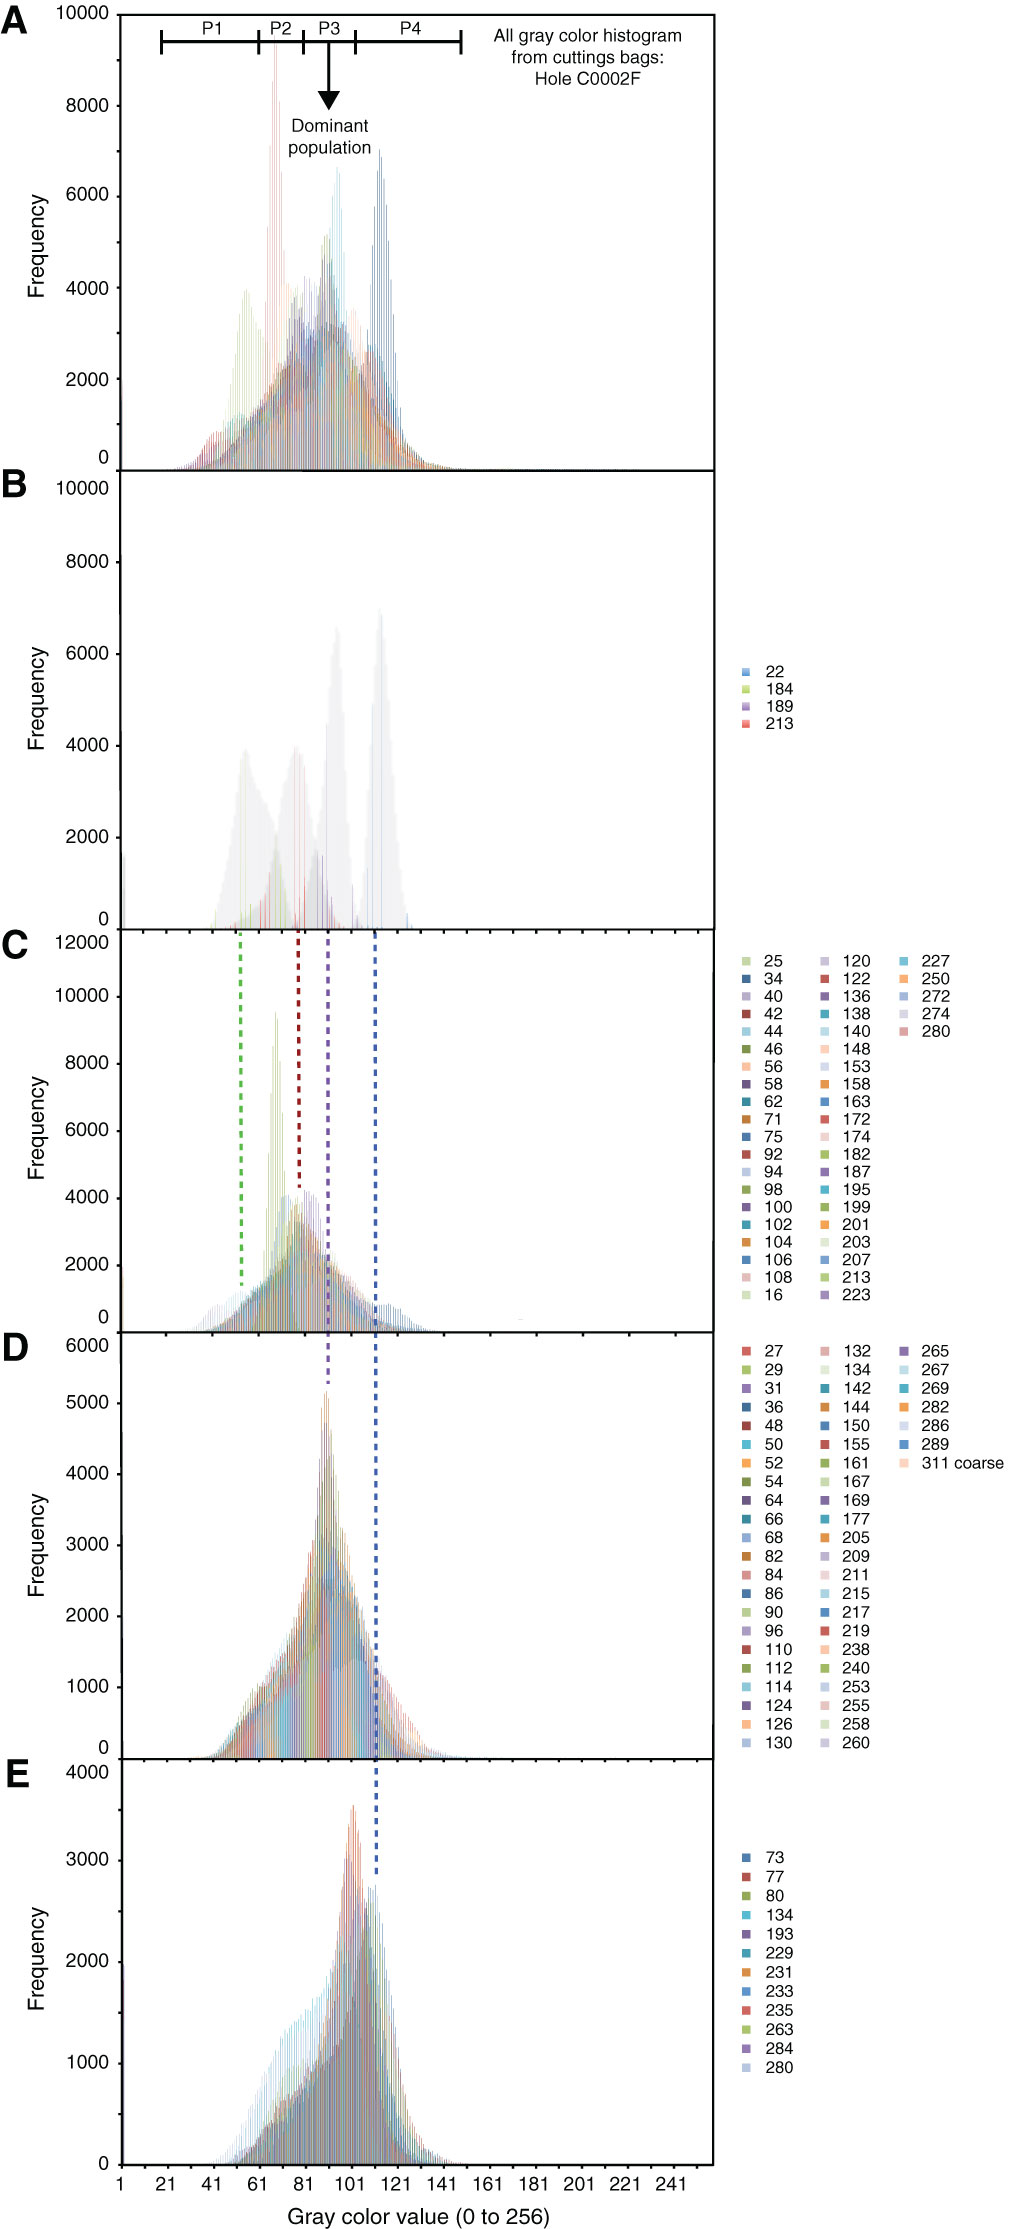
Figure F103. Histograms of gray color distribution in 8 bits from (A) all cuttings photographs using a circular window 11 pixels in diameter, Hole C0002F. B. Four populations from the collection are discriminated based on their maximum peak gray intensity. The cuttings collection was classified based on these four populations: (C) Population P1 centered at 50 grayscale and occurring among all the collections, Population P2 centered at 75 grayscale, (D) Population P3 centered at 95 grayscale, and (E) Population P4 centered at 110 grayscale.
Previous | Close | Next | Top of page