Previous | Close | Next
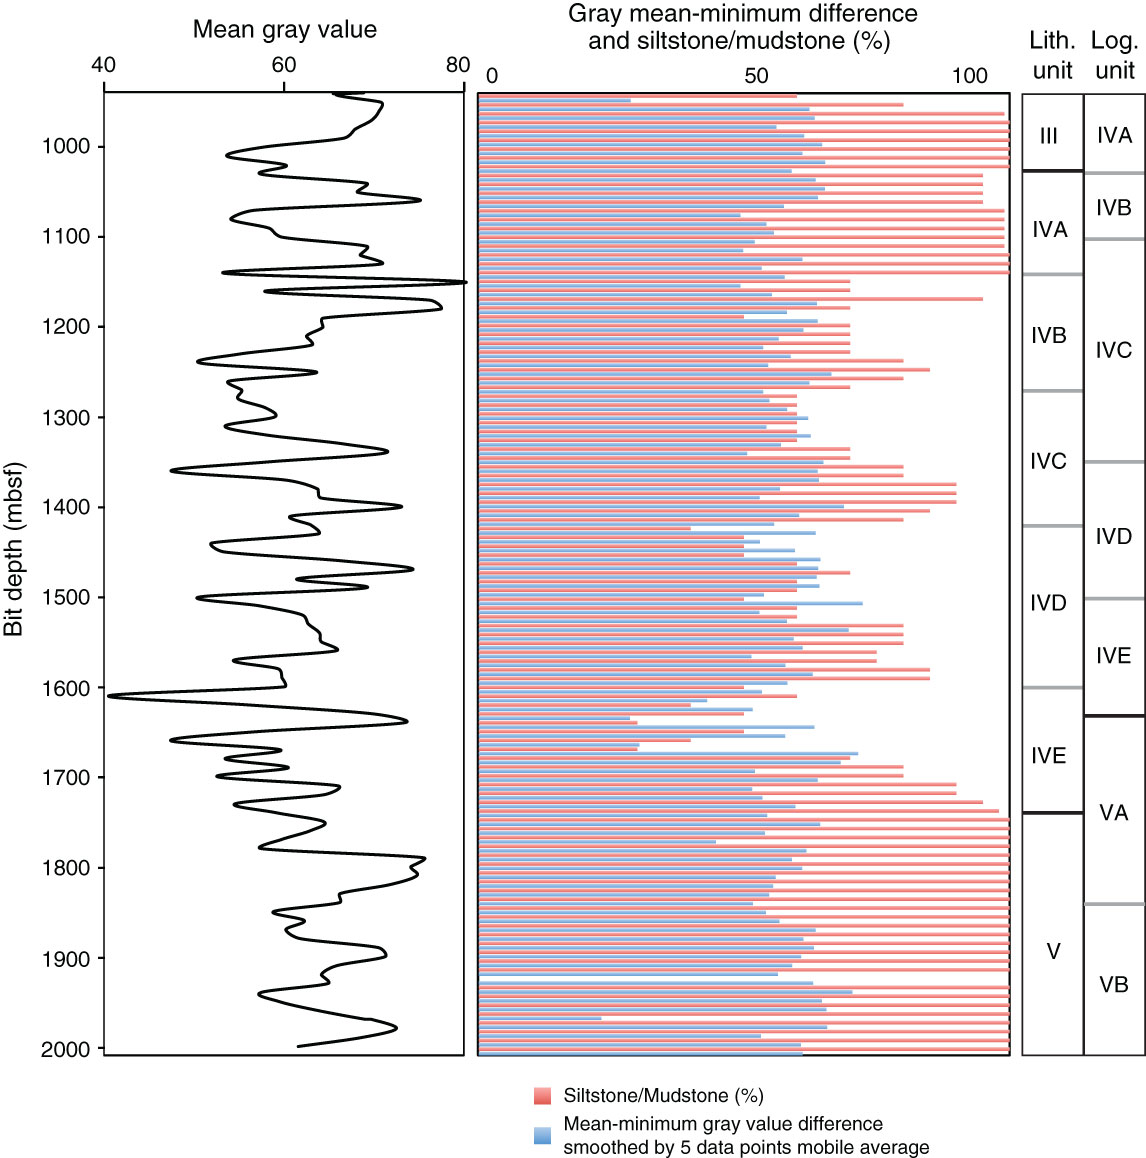
Figure F104. Distribution of the mean gray values with depth and the grayscale difference between the minimum accounted from the gray color histogram and the mean gray value on each cuttings sample, Hole C0002F.
Previous | Close | Next | Top of page