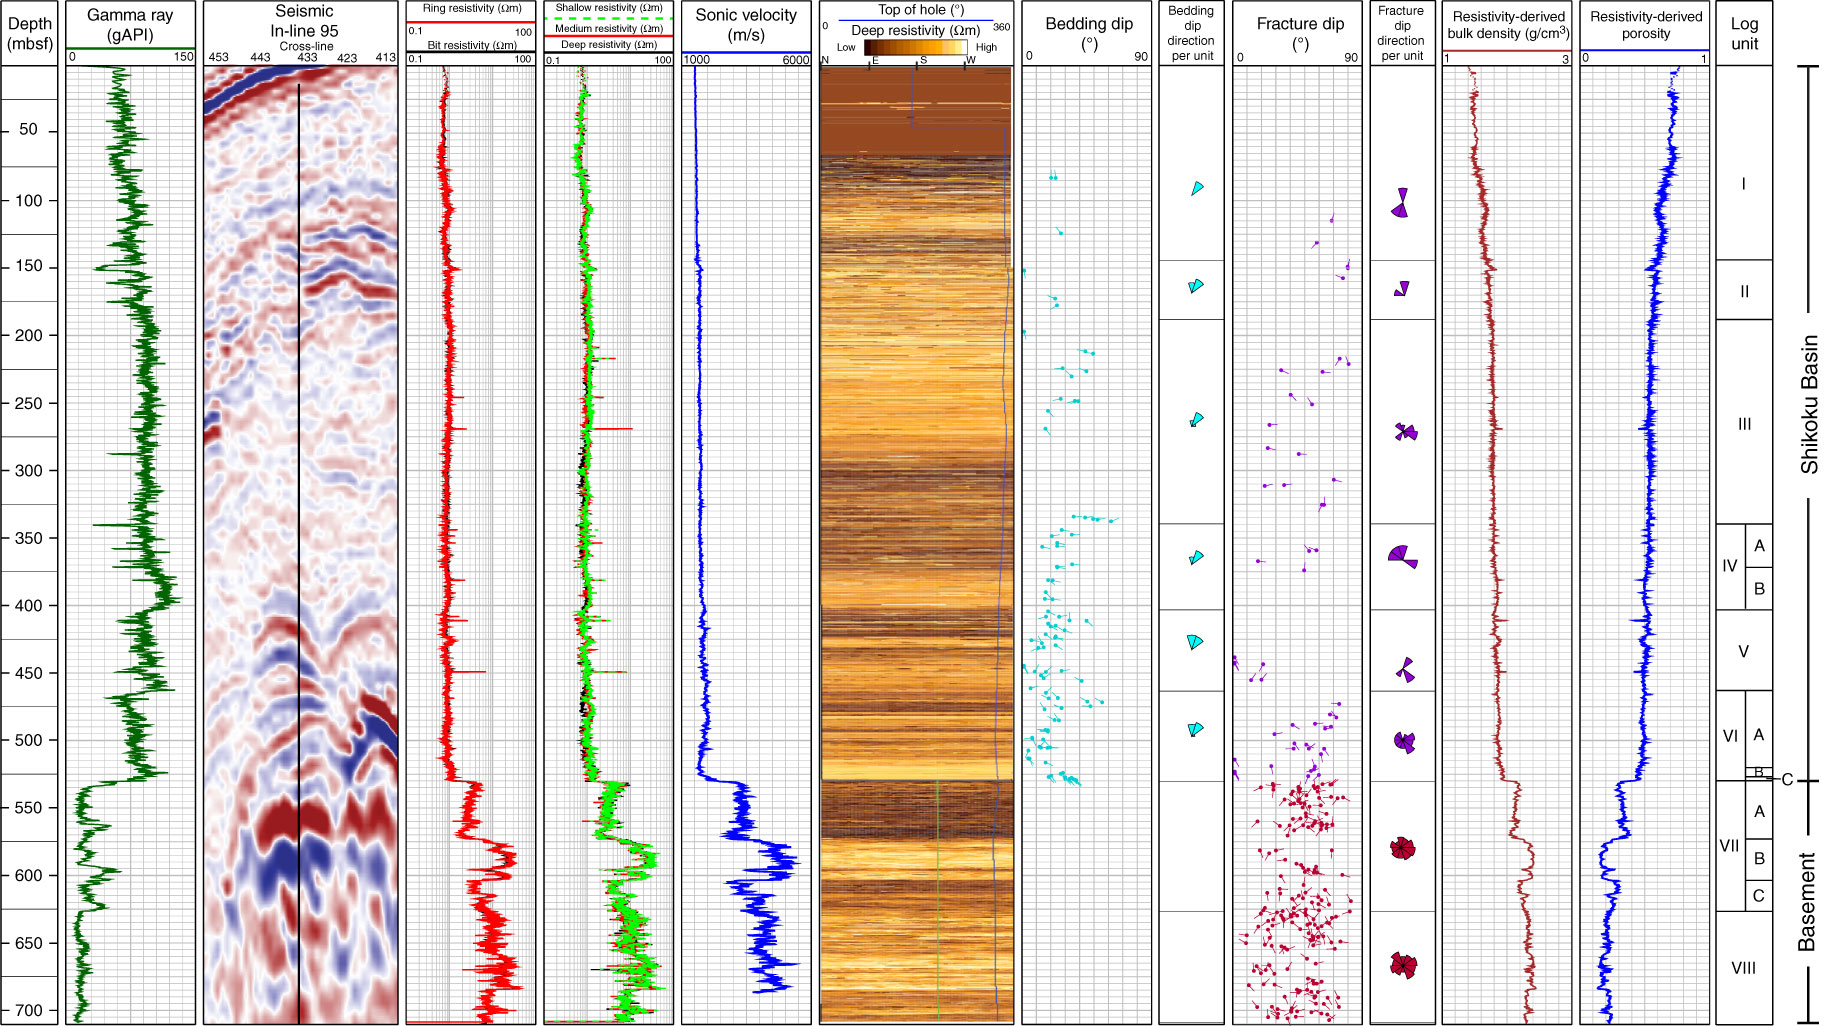
Figure F4. Composite plot of LWD data for Hole C0012H, showing gamma ray, seismic data, resistivity, sonic velocity, deep button resistivity image, bedding and fracture dips, resistivity-derived bulk density and porosity, and logging units. The resistivity image has been normalized for the basement separate to the Shikoku Basin section.
Previous | Close | Next | Top of page