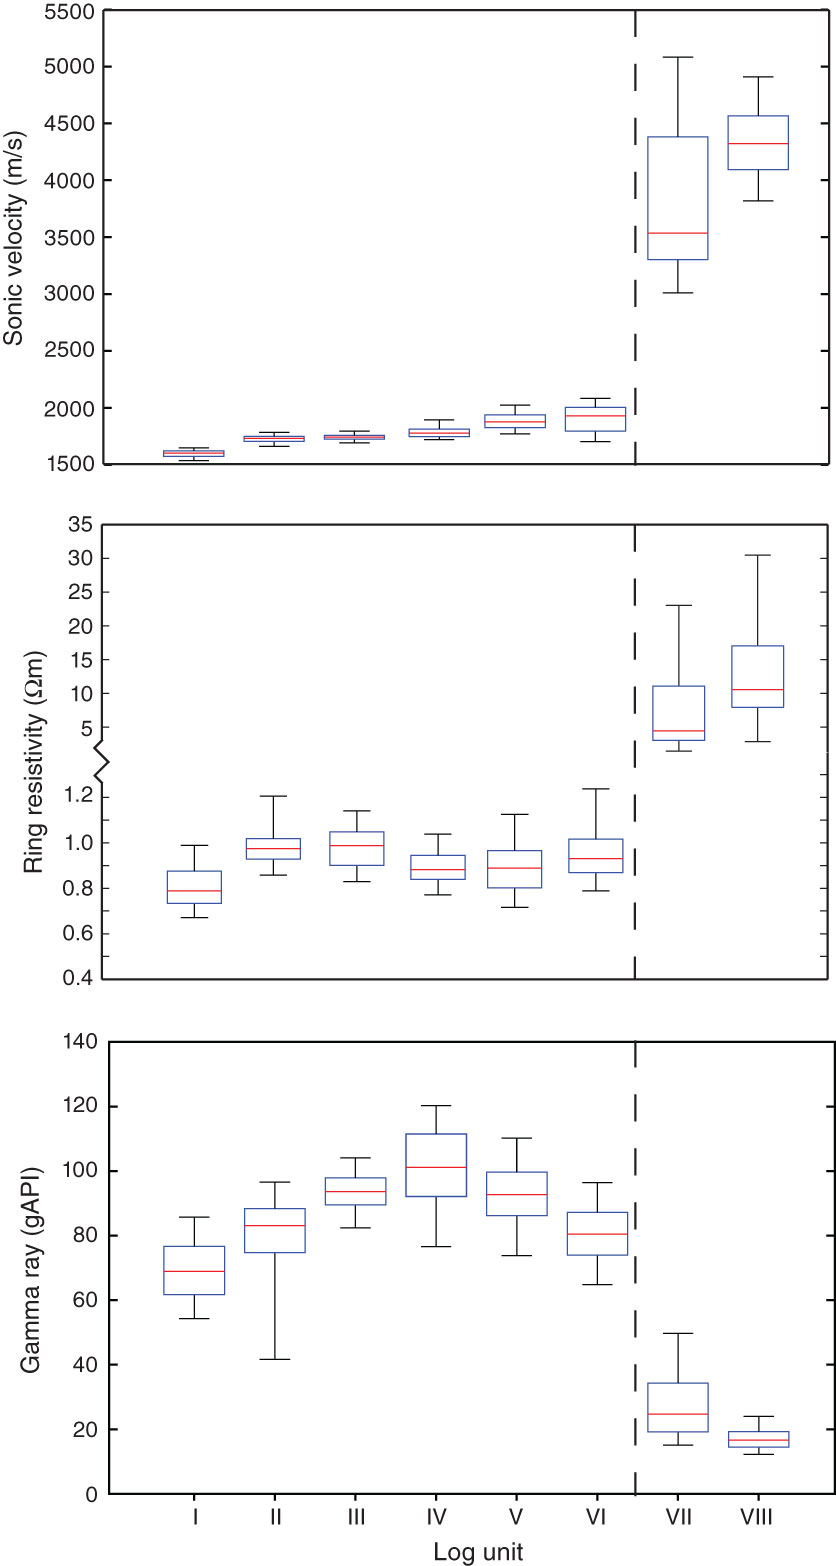
Figure F5. Box and whisker plots of logging units for gamma ray, resistivity, and sonic velocity, illustrating the large change in values between Shikoku Basin sediment and basement rock. The box bounds represent the 25th and 75th percentile values per unit, and the error bars reach the maximum and minimum values recorded, excluding any identified outliers.
Previous | Close | Next | Top of page