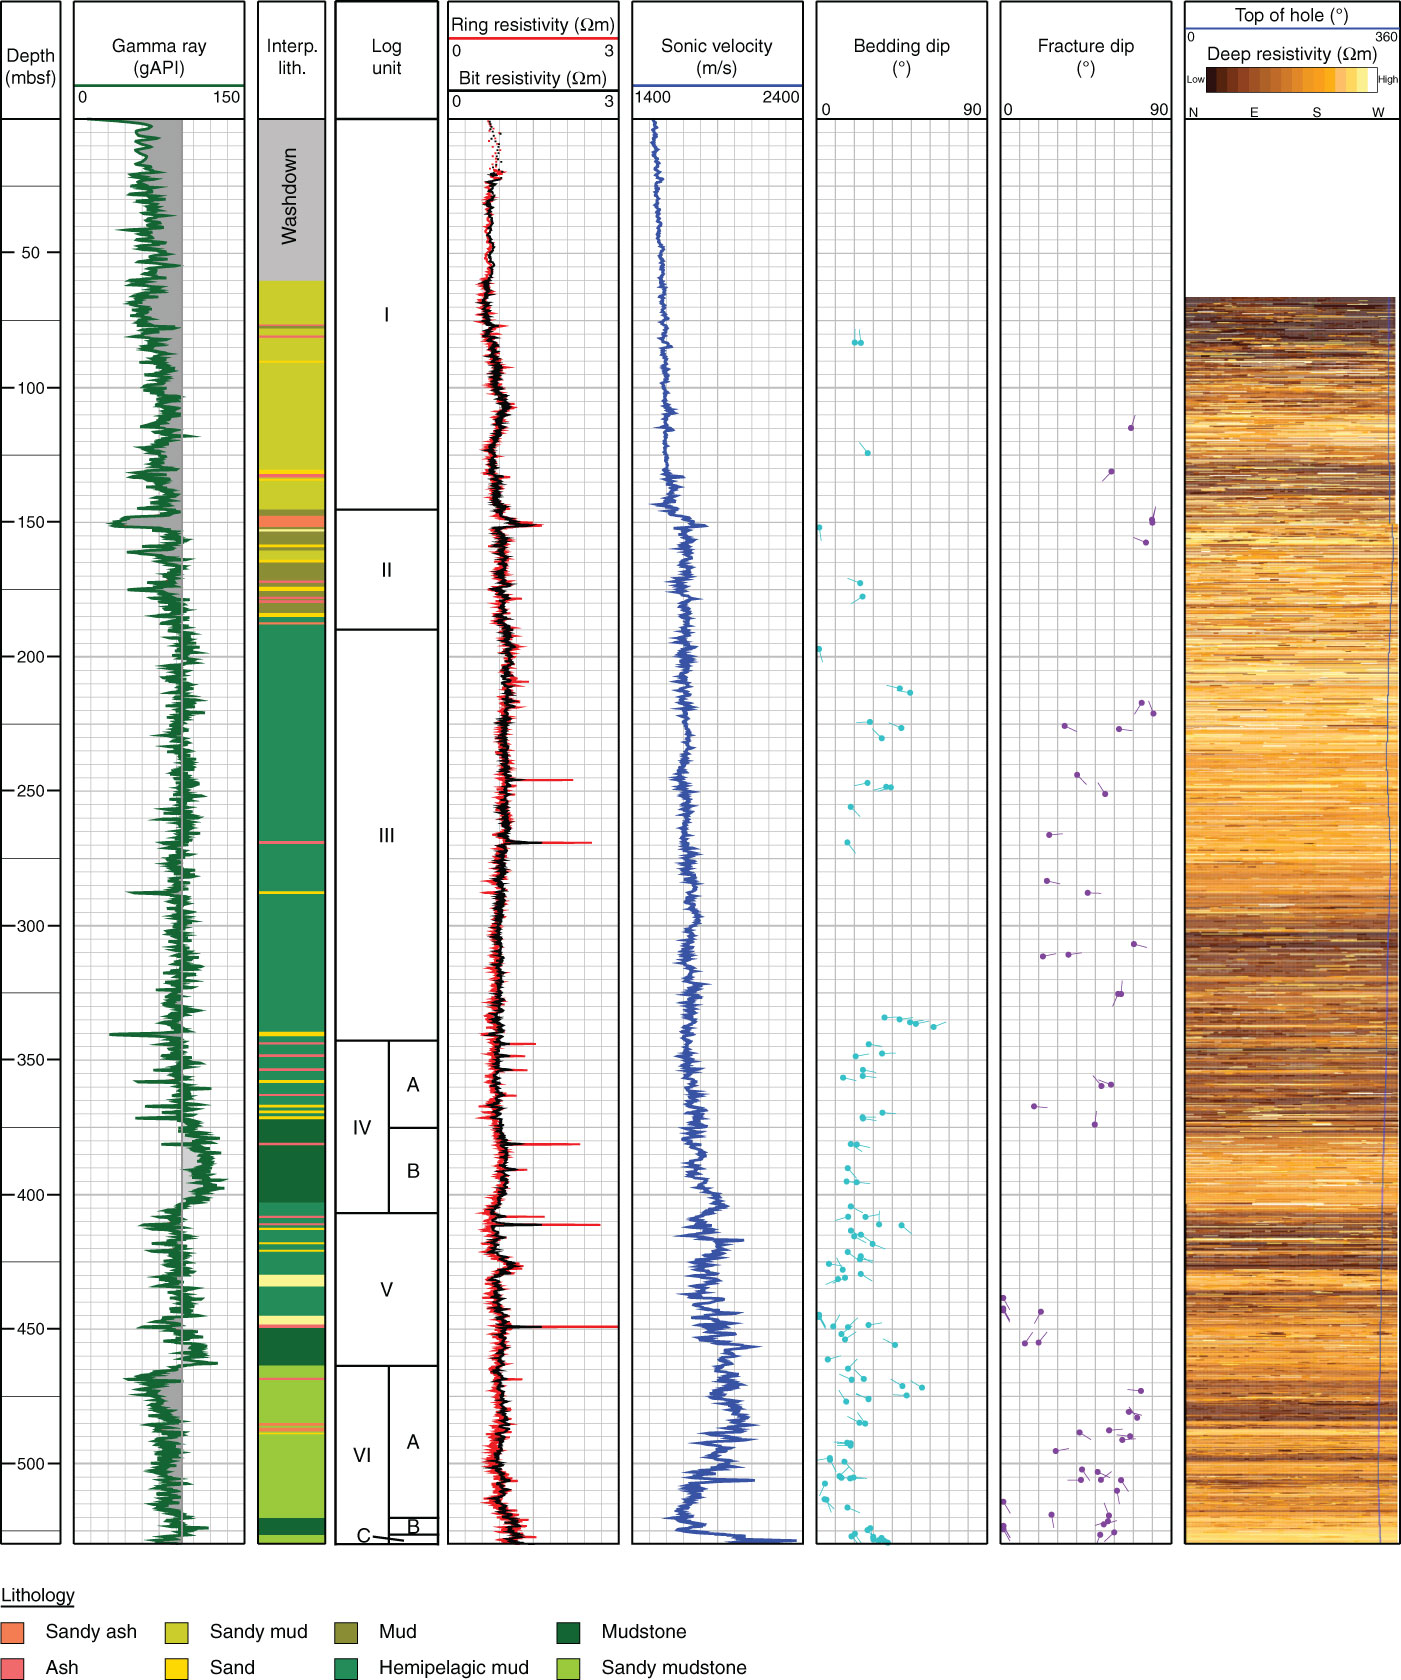
Figure F6. Composite plot of the LWD data for the sediment section (0–530.3 mbsf), showing gamma ray, interpreted lithology (Interp. lith.), logging units, resistivity, sonic velocity, bedding and fracture dips, and deep button resistivity image. The gamma ray baseline was set to 95 gAPI to highlight changes in bulk lithology.
Previous | Close | Next | Top of page