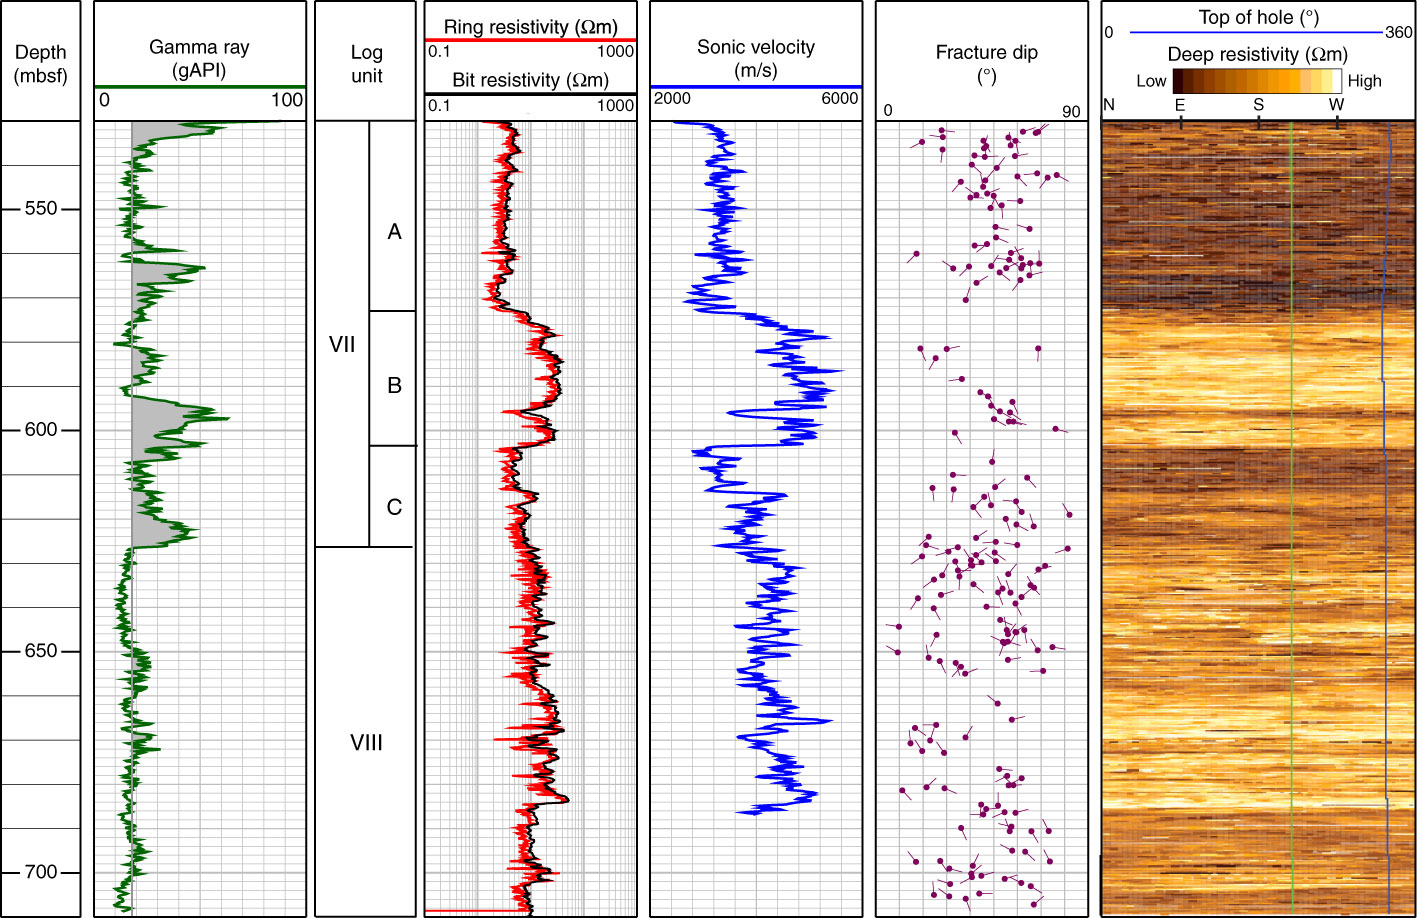
Figure F7. Composite plot of the LWD data for the basement section (530.3–710.0 mbsf), showing gamma ray, logging units, resistivity, sonic velocity, fracture dip, and deep button resistivity image. The gamma ray baseline was set to 18 gAPI, and gray shading highlights higher gamma ray values.
Previous | Close | Next | Top of page