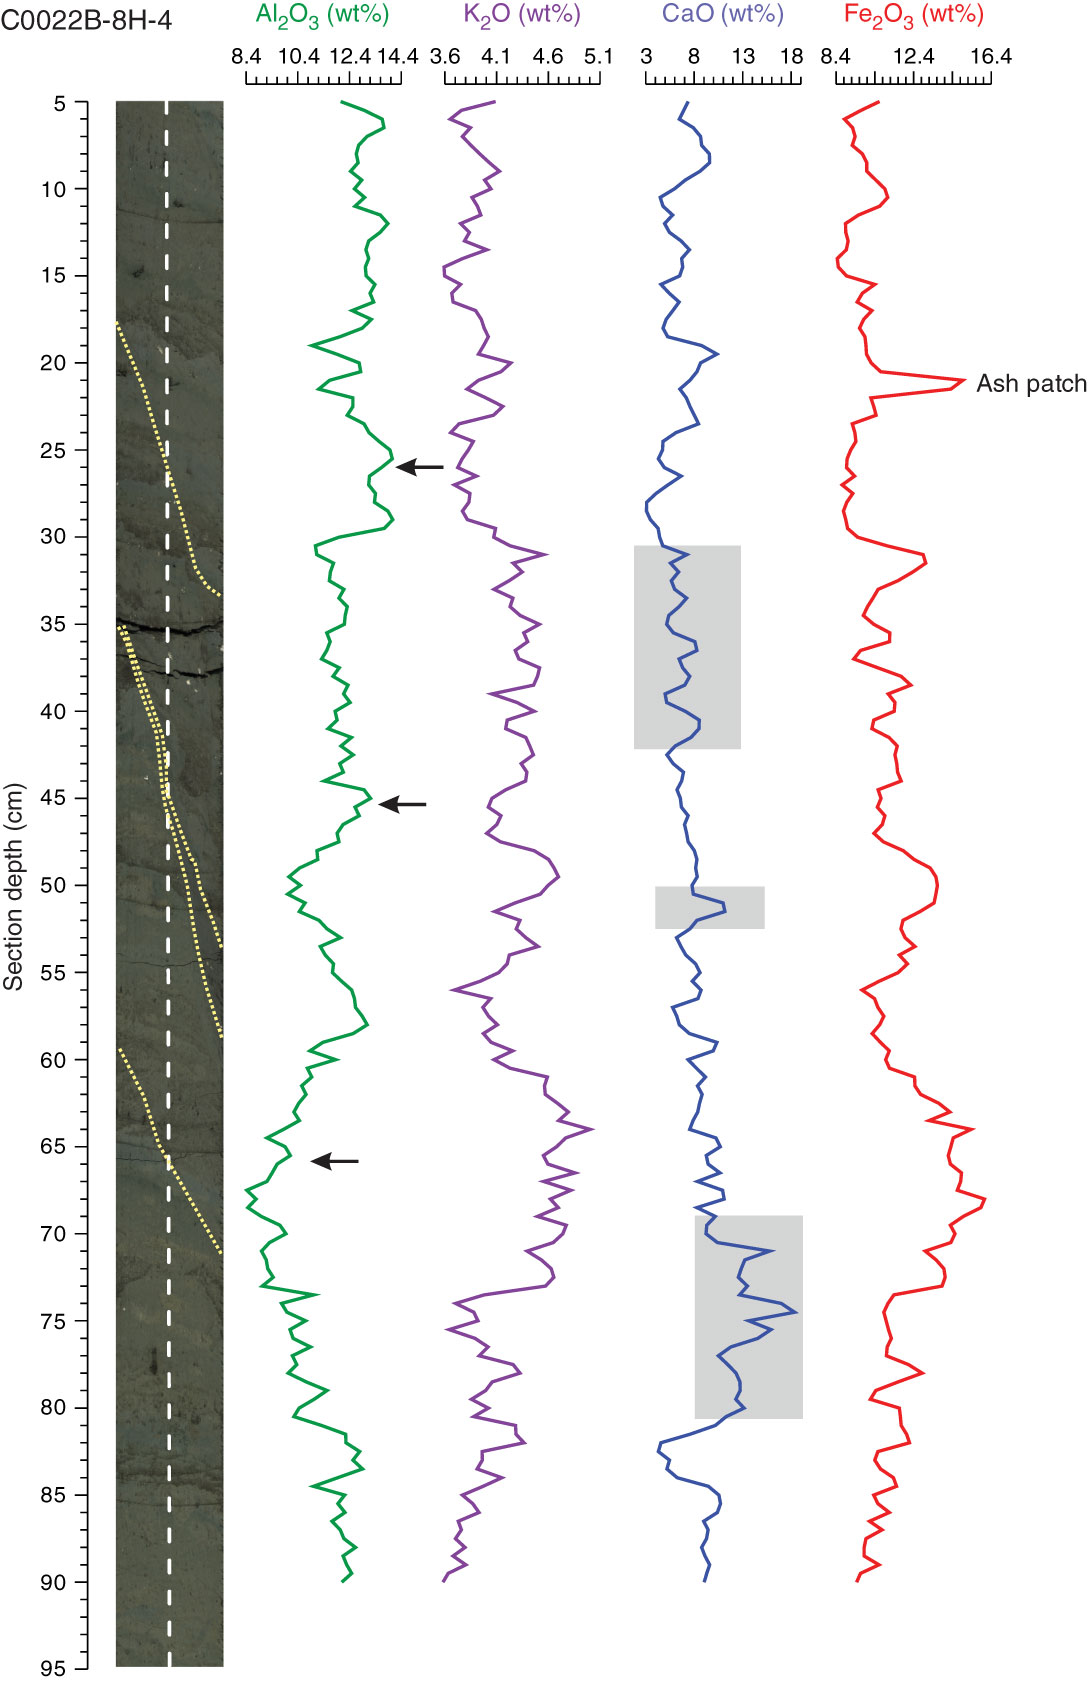
Figure F16. XRF line scan of interval 338-C0022B-8H-4, 5–90 cm. Yellow dashed lines = shear bands, arrows = points at which the scan crosses the bands, gray shading = regions of light-colored lithology that has somewhat higher carbonate content.
Previous | Close | Next | Top of page