Previous | Close | Next
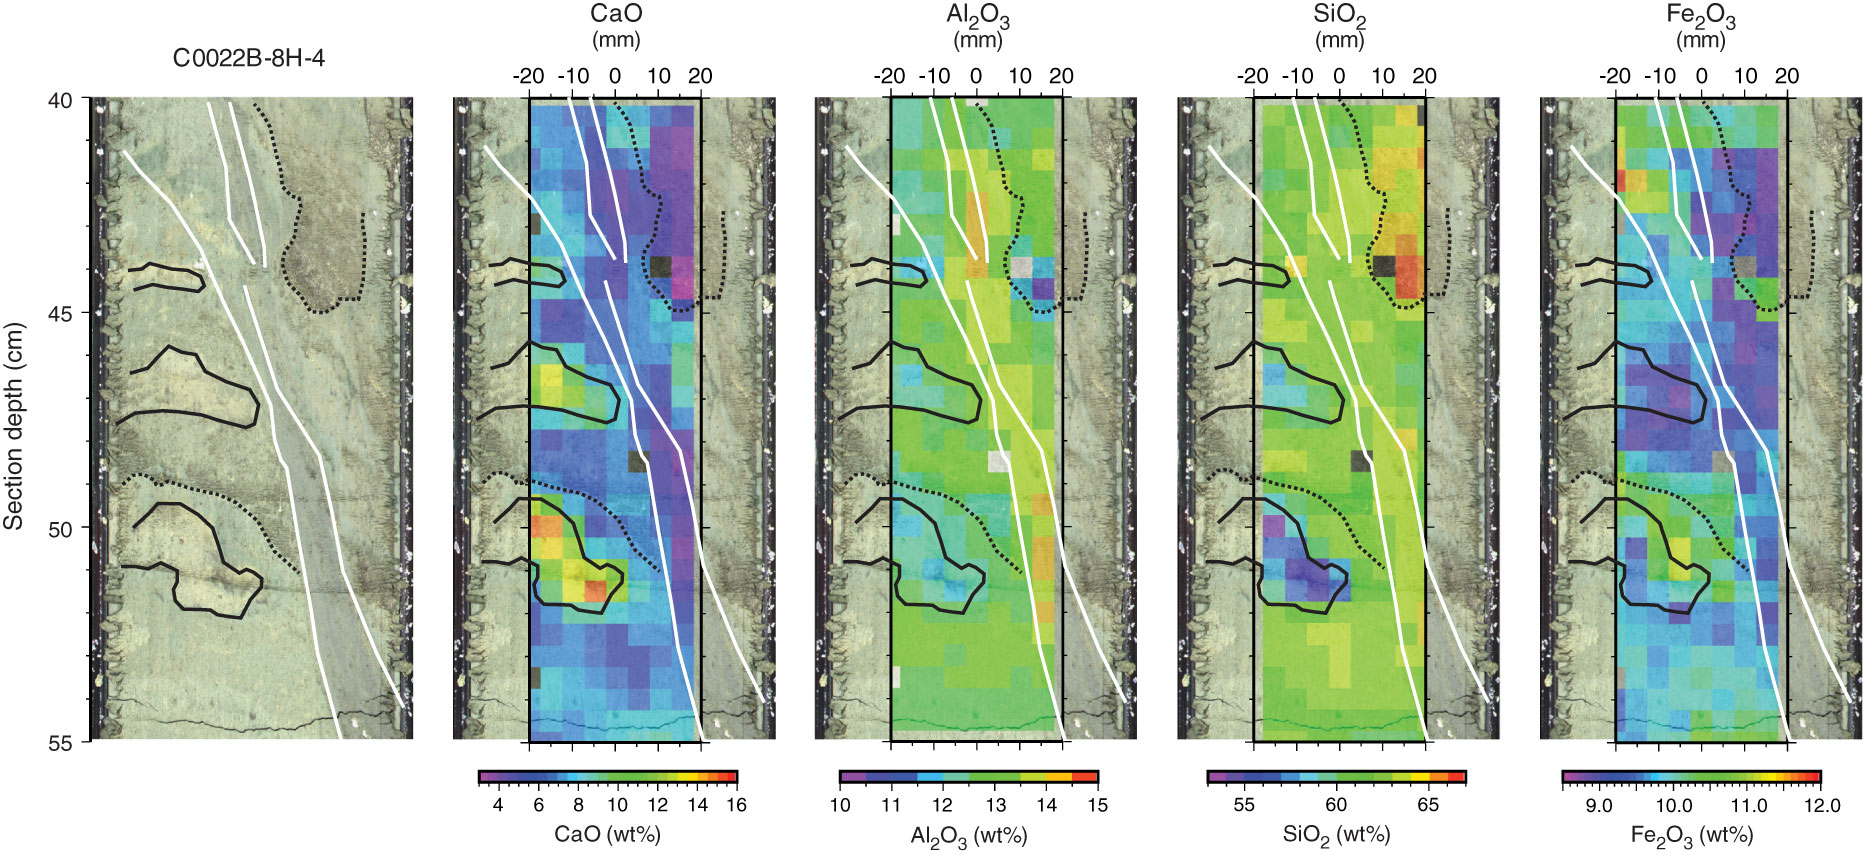
Figure F17. XRF mapping scan of interval 338-C0022B-8H-4, 40–55 cm. Black outlines = color contrasts as seen on the core surface, white lines = shear bands or possible faults.
Previous | Close | Next | Top of page