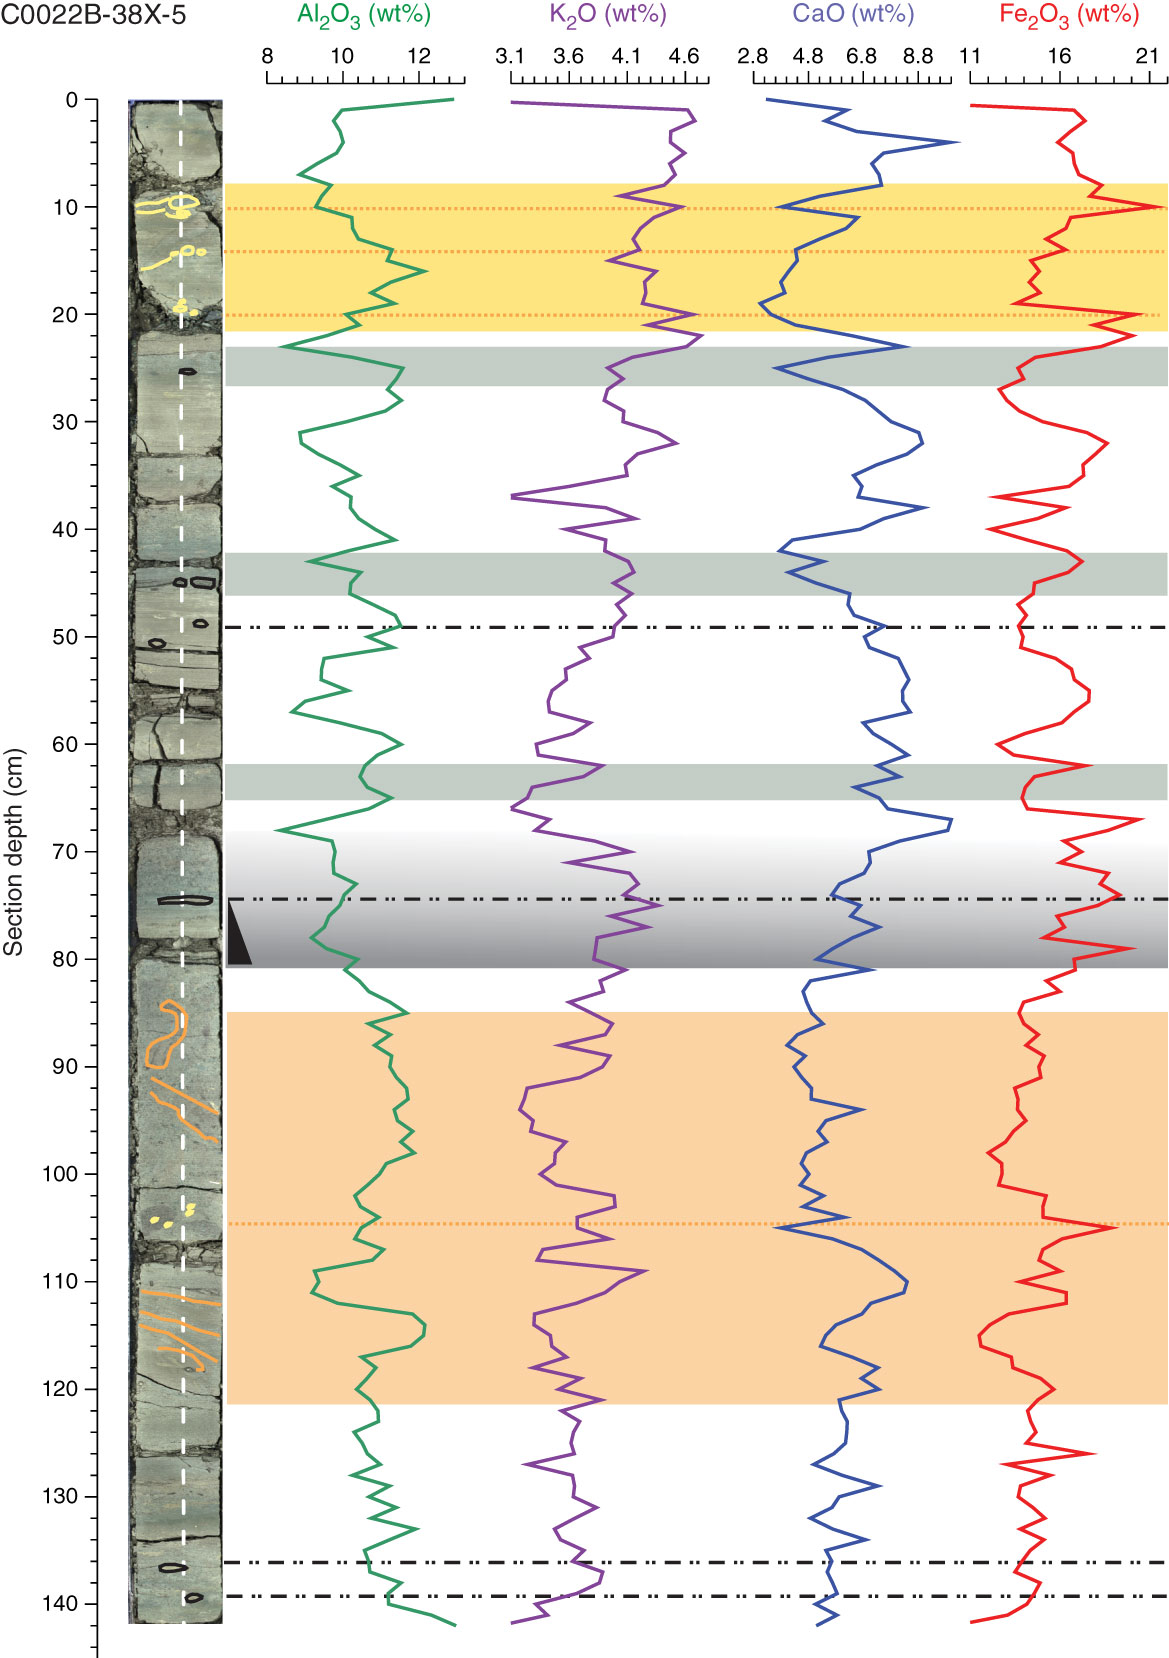
Figure F18. XRF line scan of interval 338-C0022B-38X-5, 0–142 cm. Yellow = zones rich in mud clasts, green = green color bands, black dashed line and gray shading in one intense interval = burrowed intervals, orange-shaded bands = relatively homogeneous interval other than the orange-dashed line, which is some very small mud clasts.
Previous | Close | Next | Top of page