Previous | Close | Next
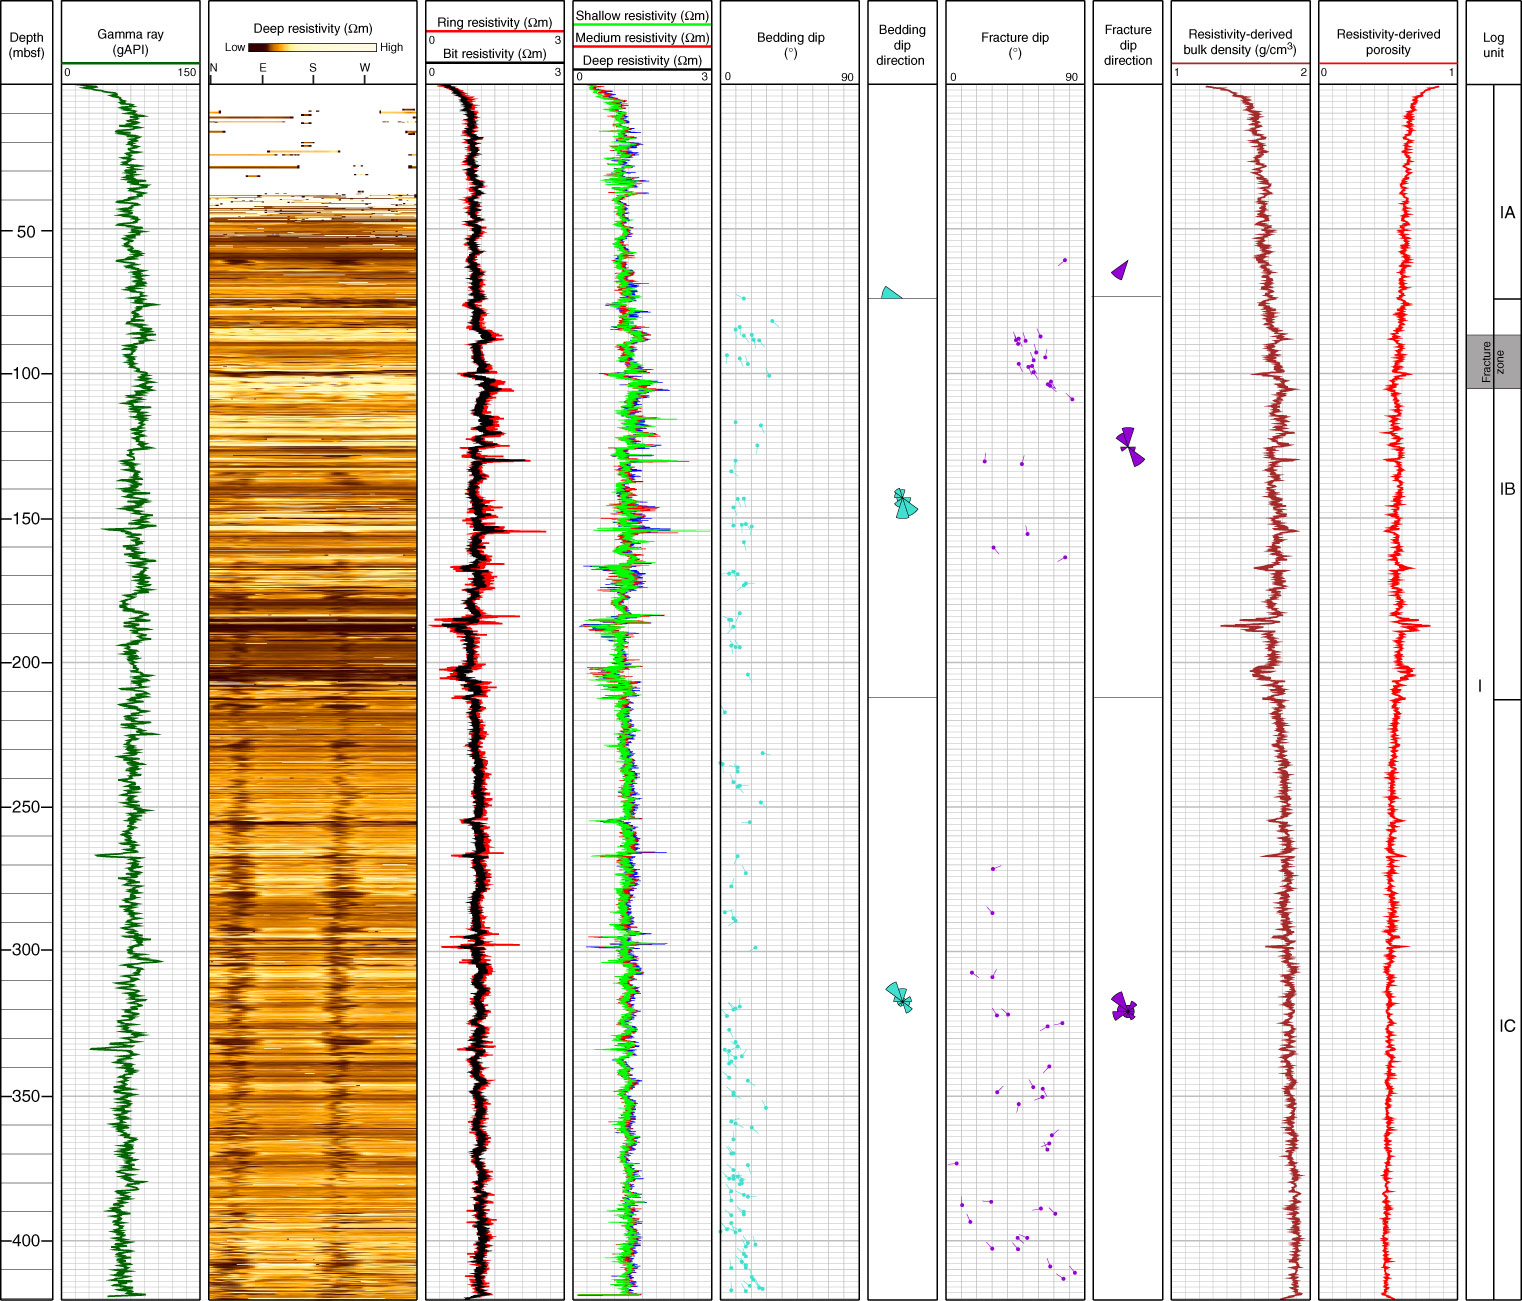
Figure F3. Overview composite plot of LWD data and deep resistivity image for Hole C0022A, with logging units, resistivity-derived porosity and bulk density, and bedding and fracture dips.
Previous | Close | Next | Top of page