Previous | Close | Next
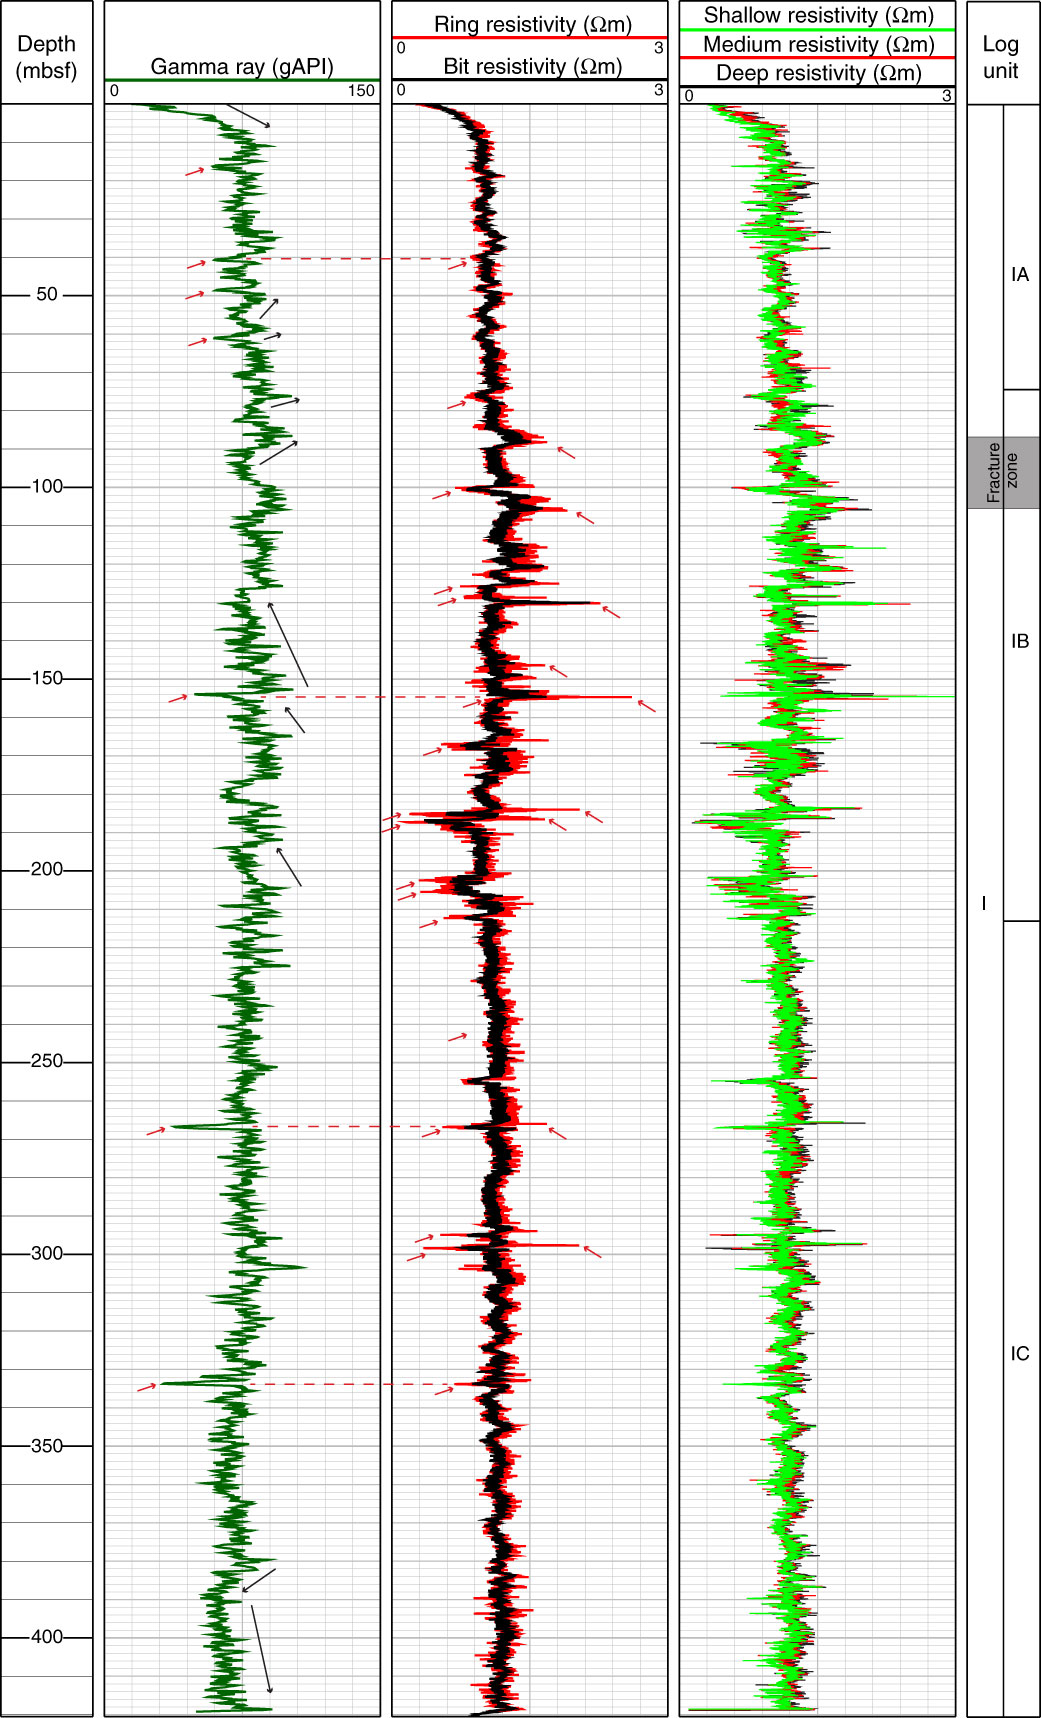
Figure F4. Composite plot of gamma ray and resistivity logs for Hole C0022A, with the observed trends and spikes highlighted. Black arrows = overall trends, red arrows = points of prominent high and low spikes.
Previous | Close | Next | Top of page