Previous | Close | Next
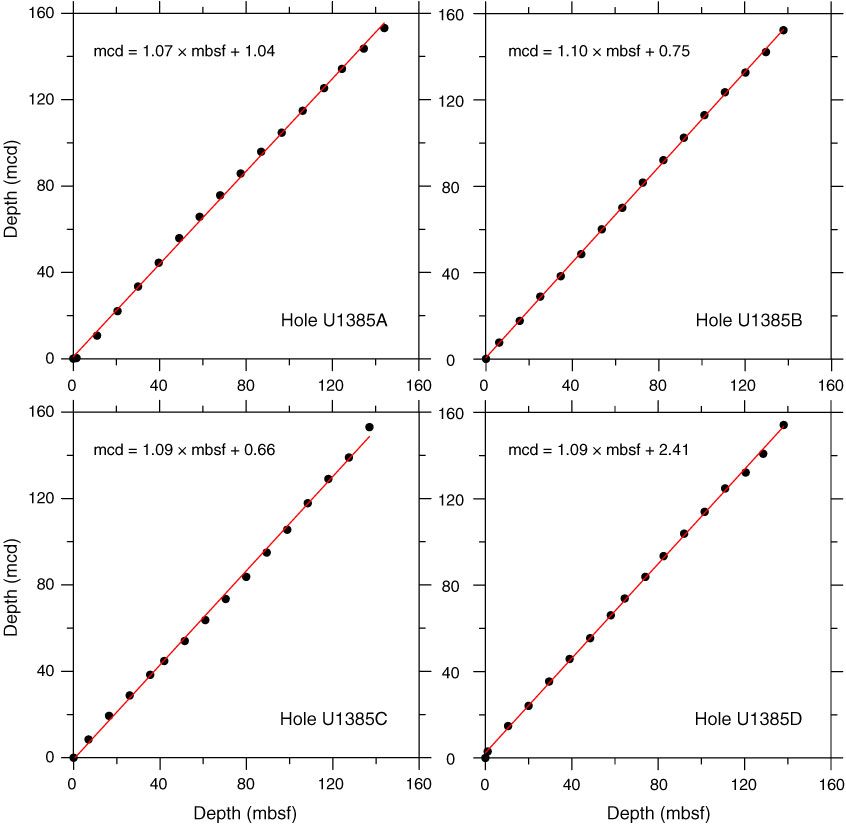
Figure F36. Plots of core top depths for mbsf vs. mcd. Lines fit through the core top depths for each hole give the relative expansion of the mcd scale relative to the mbsf scale.
Previous | Close | Next | Top of page