Previous | Close | Next
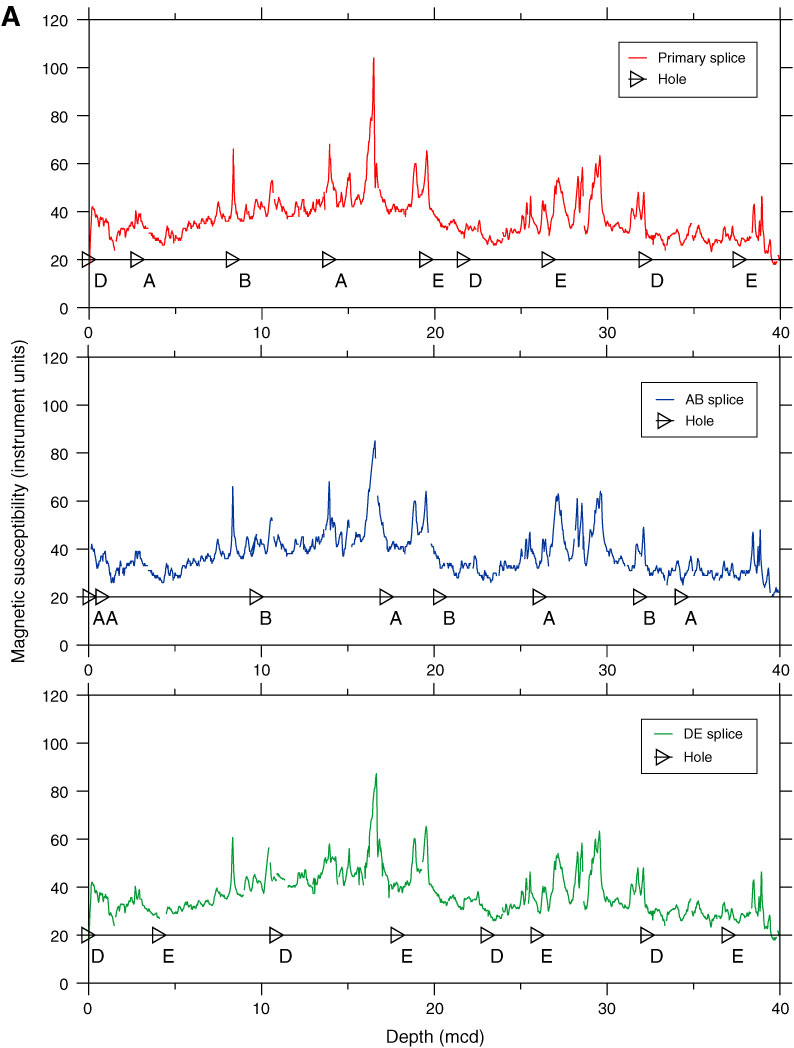
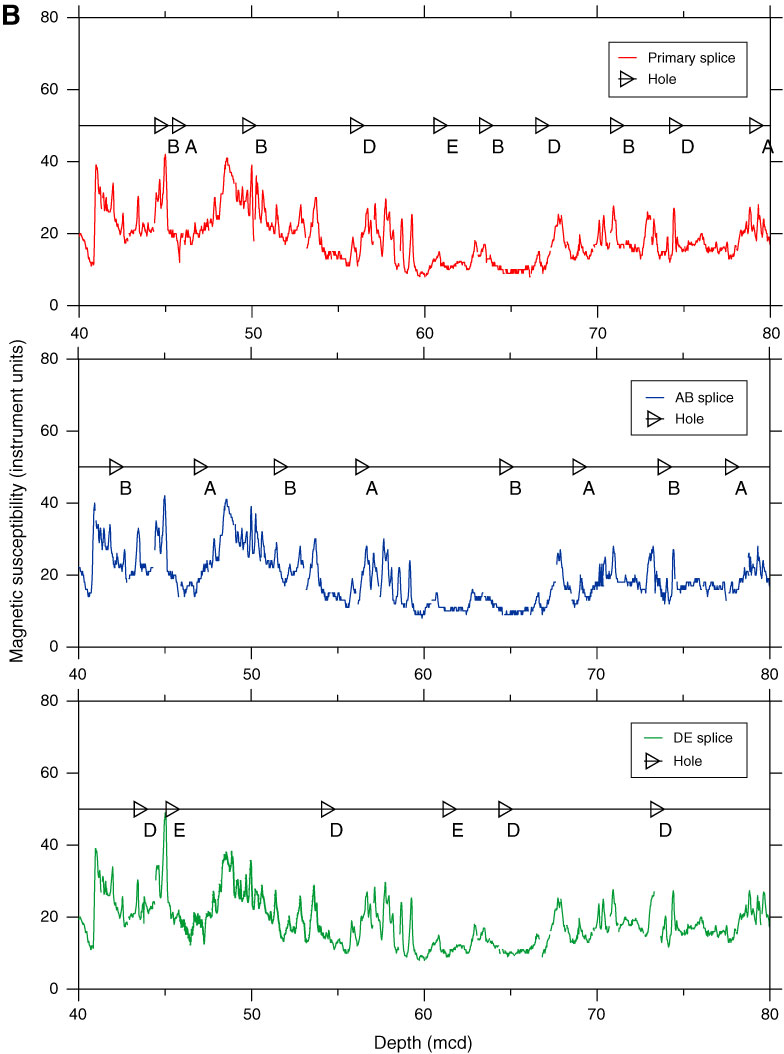
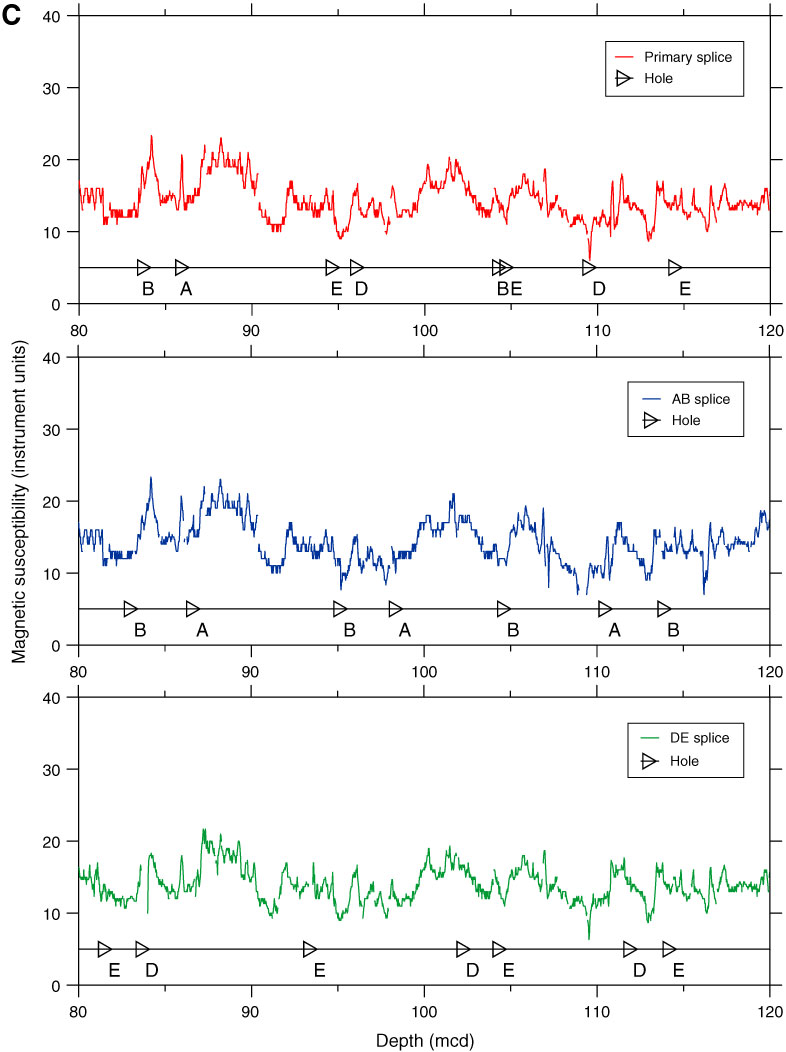
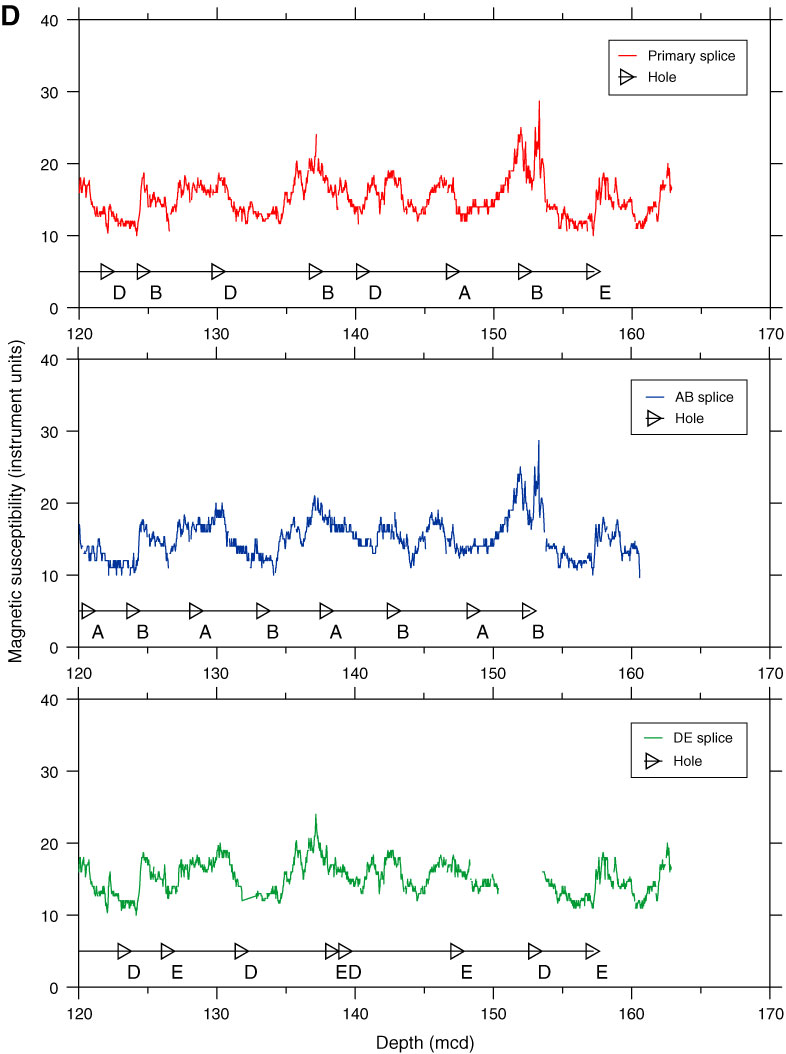
Figure F37. Plots of secondary stratigraphic splices compared with the primary splice, Site U1385. A. 0–40 mcd. B. 40–80 mcd. C. 80–120 mcd. D. 120–170 mcd.
Previous | Close | Next | Top of page