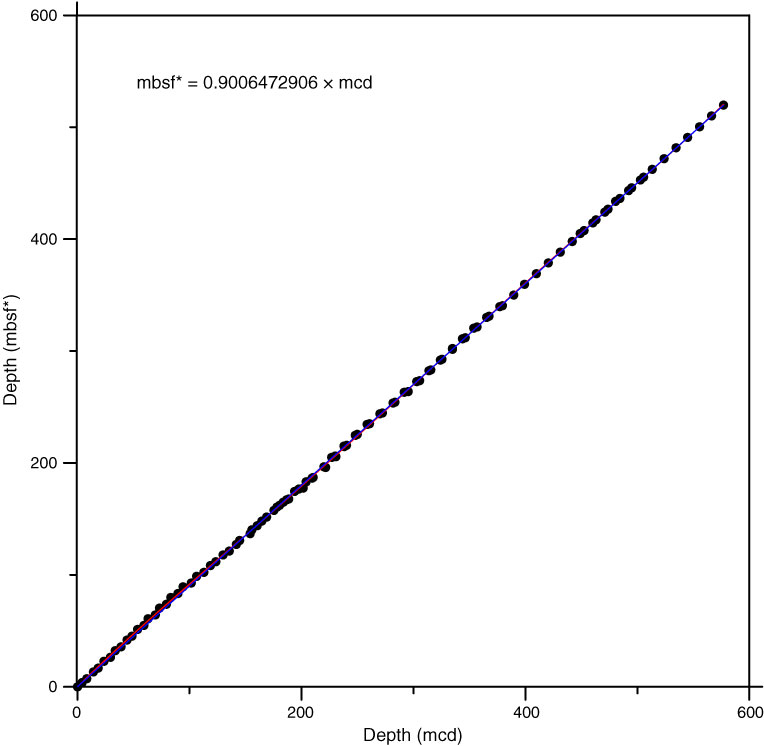
Figure F57. Plot of core top depths for mcd vs. mbsf*, Holes U1386A–U1386C. Line fits through the core top depths of all holes give an estimate of the amount the mcd scale has to be compressed to derive the mbsf* scale (see text).
Previous | Close | Next | Top of page