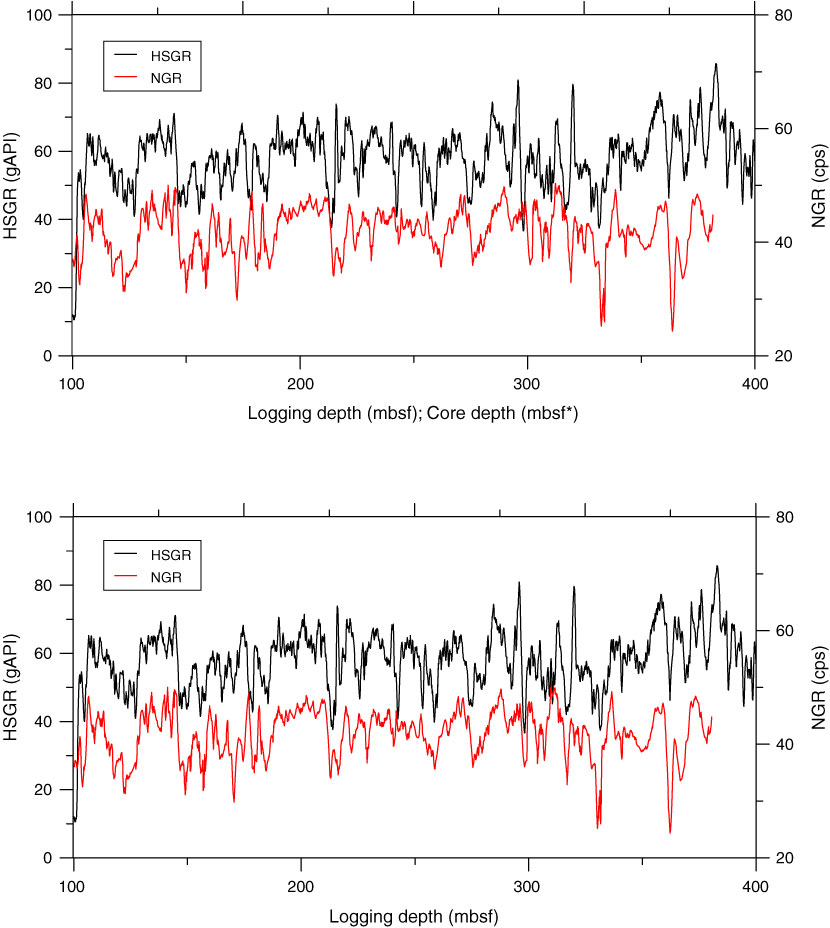
Figure F58. Plots of comparison between the logging standard (total) gamma ray (HSGR) data in Hole U1386C and the (five-point average) natural gamma ray (NGR) data in Holes U1386A and U1386B plotted on the mbsf scale (below) and a corrected mbsf* scale (above).
Previous | Close | Next | Top of page