Previous | Close
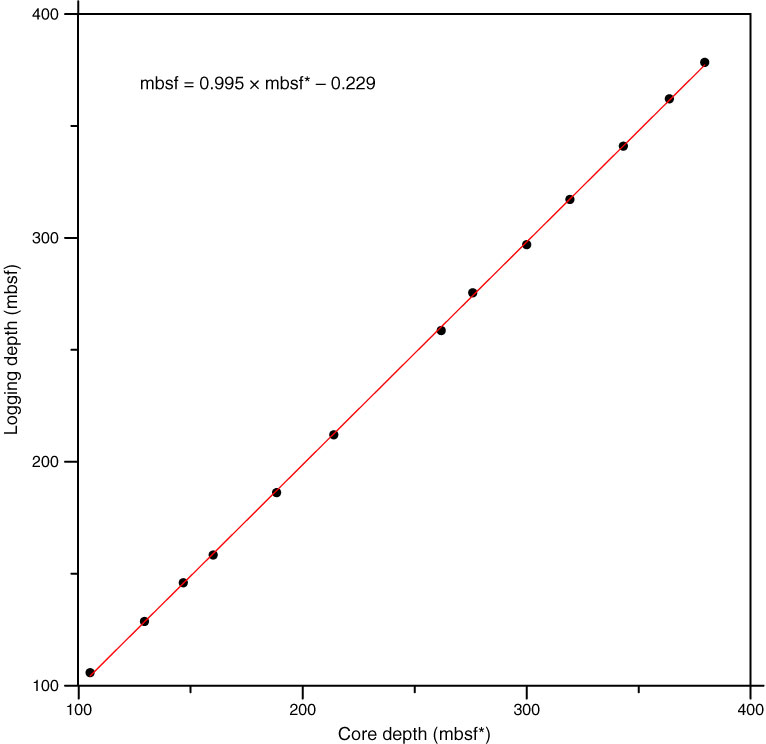
Figure F59. Plot of linear regression fit through 11 tie points between the NGR data in Holes U1386A and U1386B on the mbsf* scale and logging standard (total) gamma ray data in Hole U1386C on the mbsf scale.
Previous | Close | Top of page