Previous | Close | Next
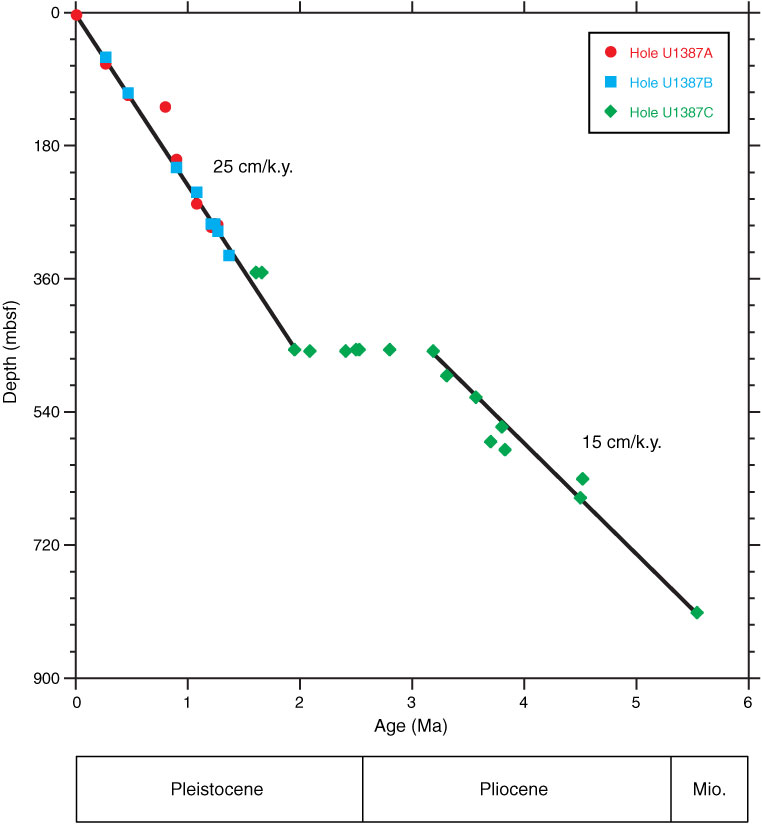
Figure F25. Biostratigraphic events vs. depth, Site U1387. Events are plotted at their mean depth (Table T5).
Previous | Close | Next | Top of page