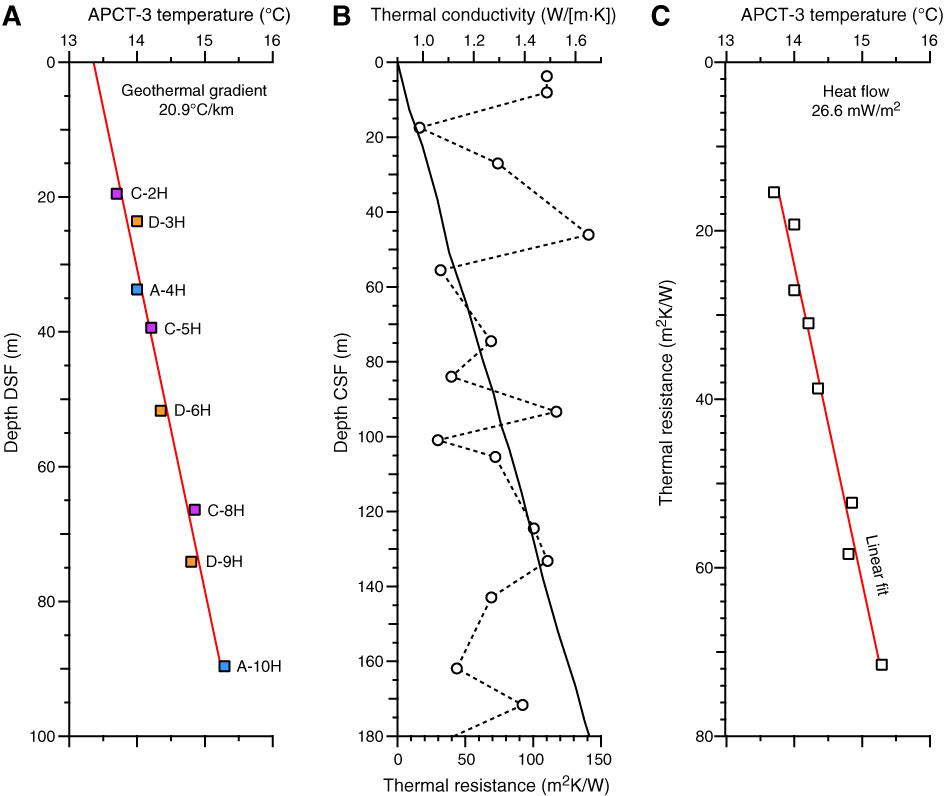
Figure F48. Plots of heat flow calculations, Site U1386. A. Sediment temperatures in Holes U1389A (blue), U1389C (purple), and U1389D (orange). B. Thermal conductivity data from Hole U1389A (circles) with calculated thermal resistance (solid line). C. Bullard plot of heat flow calculated from a linear fit of the temperature data.
Previous | Close | Next | Top of page