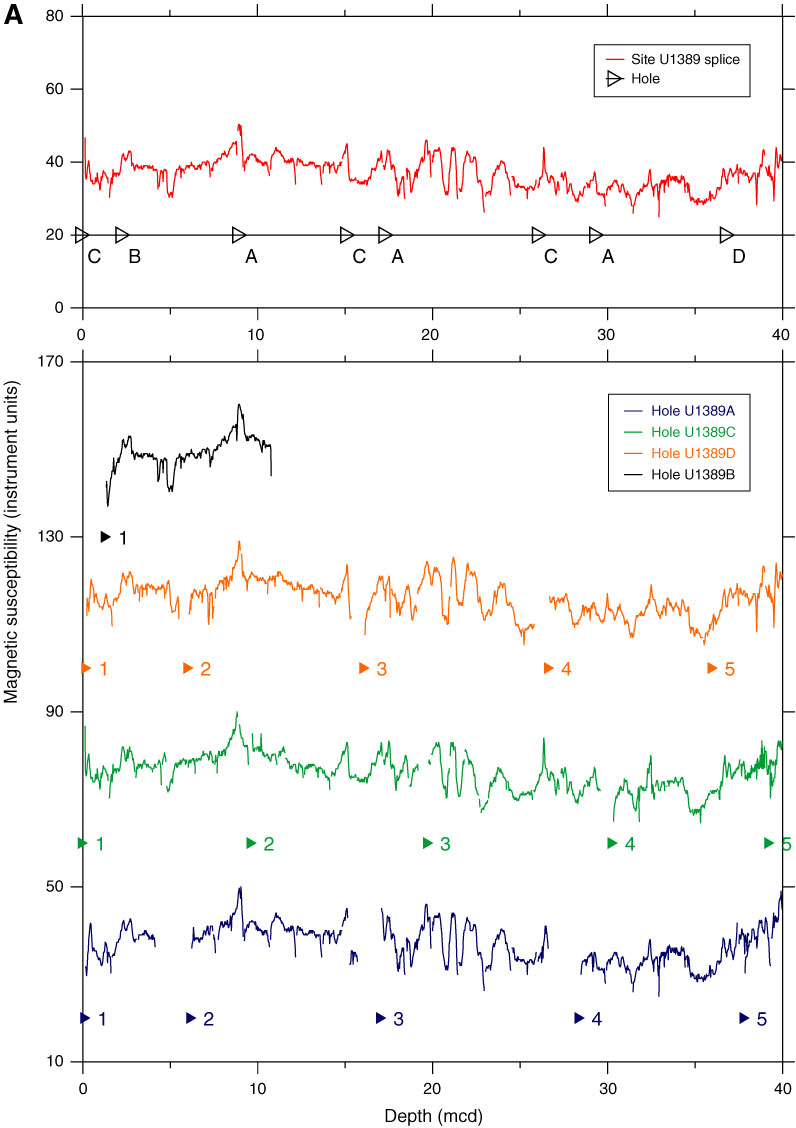
Figure F49. Plots of magnetic susceptibility vs. composite depth, Site U1389. Susceptibility values for Holes U1389B–U1389E are shifted for display purposes in the lower panel. The data are shown only for the multi-cored intervals. A. 0–40 mcd. (Continued on next eight pages.)
Previous | Close | Next | Top of page