Previous | Close | Next
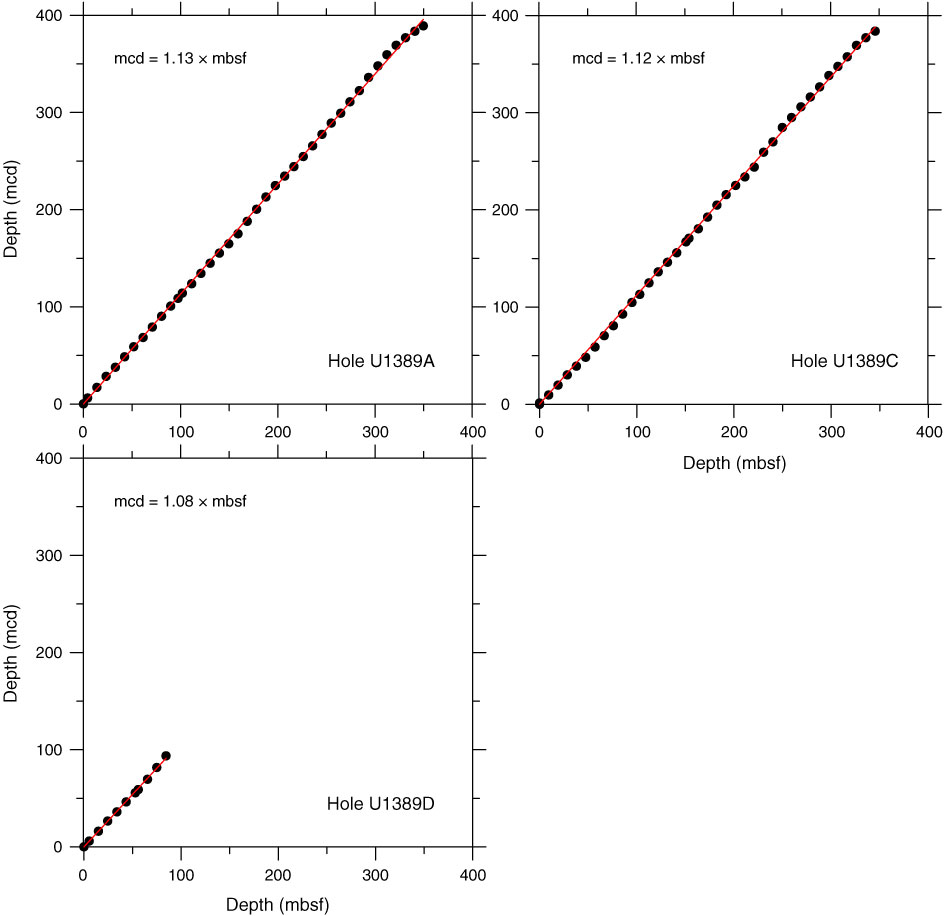
Figure F50. Plots of core top depths for mbsf vs. mcd, Site U1389. Red lines are best-fit slope.
Previous | Close | Next | Top of page