Previous | Close
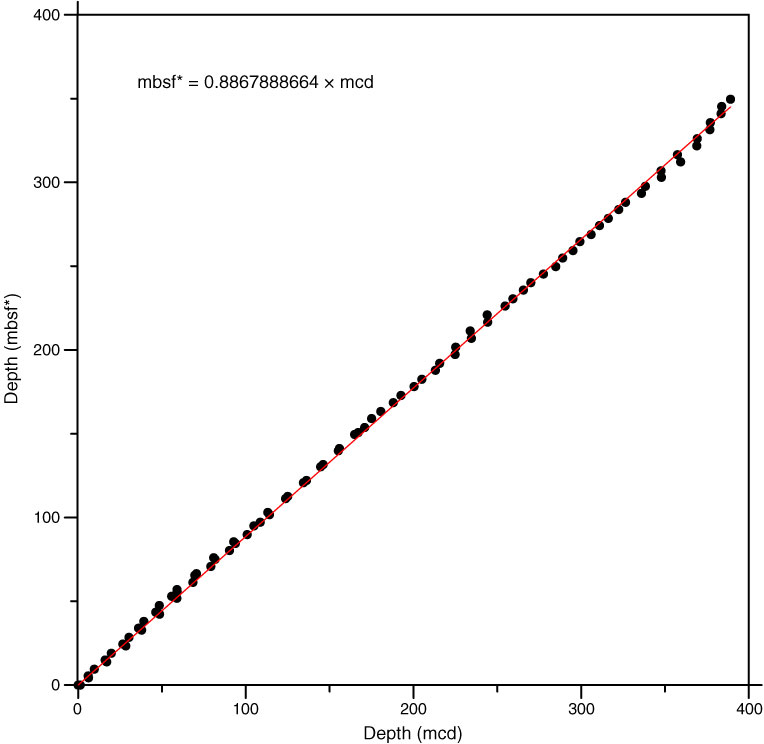
Figure F51. Plot of core top depths for mcd vs. mbsf, Holes U1389A–U1389D. Line fits through the core top depths of all holes give an estimate of the amount the mcd scale has to be compressed to derive the mbsf* scale.
Previous | Close | Top of page