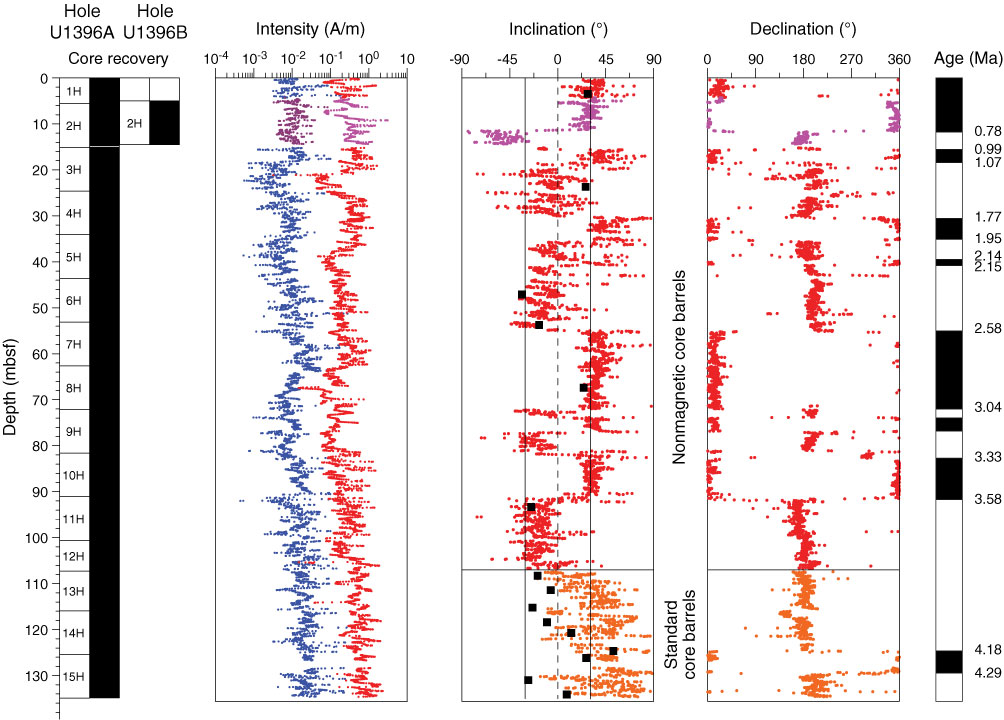
Figure F11. Plots of intensity of NRM0 (red) and NRM20 (blue) and inclination and declination after 20 mT demagnetization, Holes U1396A and U1396B. Hole U1396B data (purple) is shown spliced into the Hole U1396A record. For directional data, red points show measurements made on cores recovered with nonmagnetic barrels and orange points denote the use of standard steel barrels. All red declination points are FlexIt tool–corrected to true north for the site –15.6°W; orange points are discrete inclination guided data (see text). Black squares are discrete inclination measurements shown against a geocentric axial dipole (GAD) inclination of 30.6°. The black and white “barcode” illustrates periods of normal (black) and reversed polarity (white) with calibrated ages from the GPTS of Cande and Kent (1995).
Previous | Close | Next | Top of page