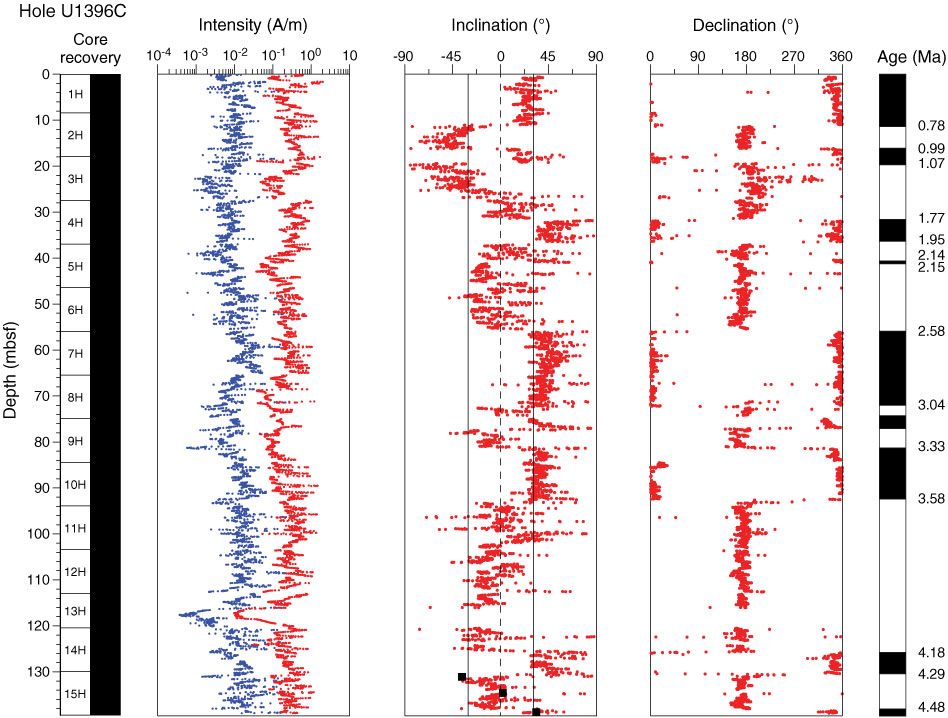
Figure F12. Plots of intensity of NRM0 (red) and NRM20 (blue) and inclination and declination after 20 mT demagnetization, Hole U1396C. All declination points are FlexIt tool–corrected to true north for the site –15.6°W. Black squares are discrete inclination measurements shown against a geocentric axial dipole (GAD) inclination of 30.6°. The black and white “barcode” illustrates periods of normal (black) and reversed polarity (white) with calibrated ages from the GPTS of Cande and Kent (1995).
Previous | Close | Next | Top of page