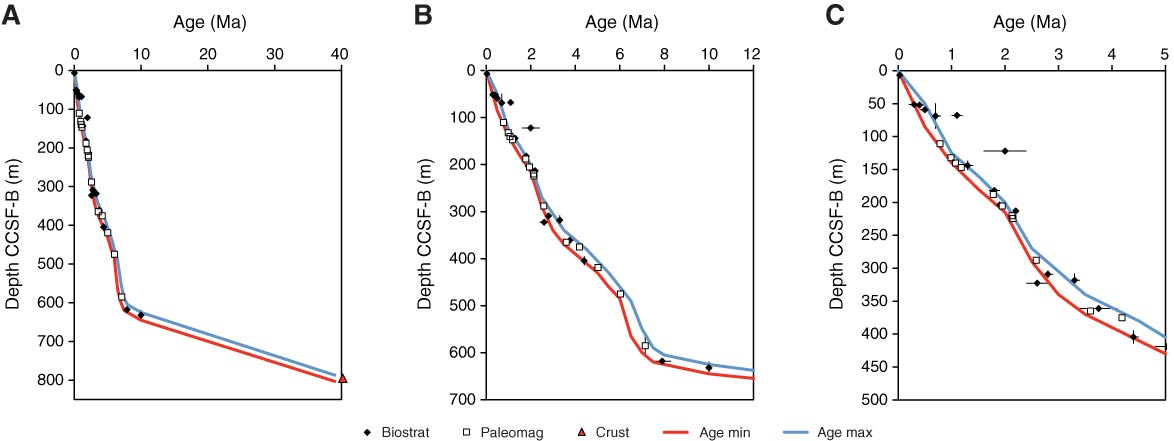
Figure F24. Shipboard age model, Site U1417. Diamonds = biostratigraphic ages, squares = paleomagnetic ages, triangles = extrapolation from the base of the borehole to underlying oceanic crust. Bars on the datums are depth and age uncertainties, here assumed to represent +2σ uncertainties. Red and blue lines are visually estimated minimum and maximum initial age models. A. 0–40 Ma. B. 0–12 Ma. C. 0–5 Ma.
Previous | Close | Next | Top of page