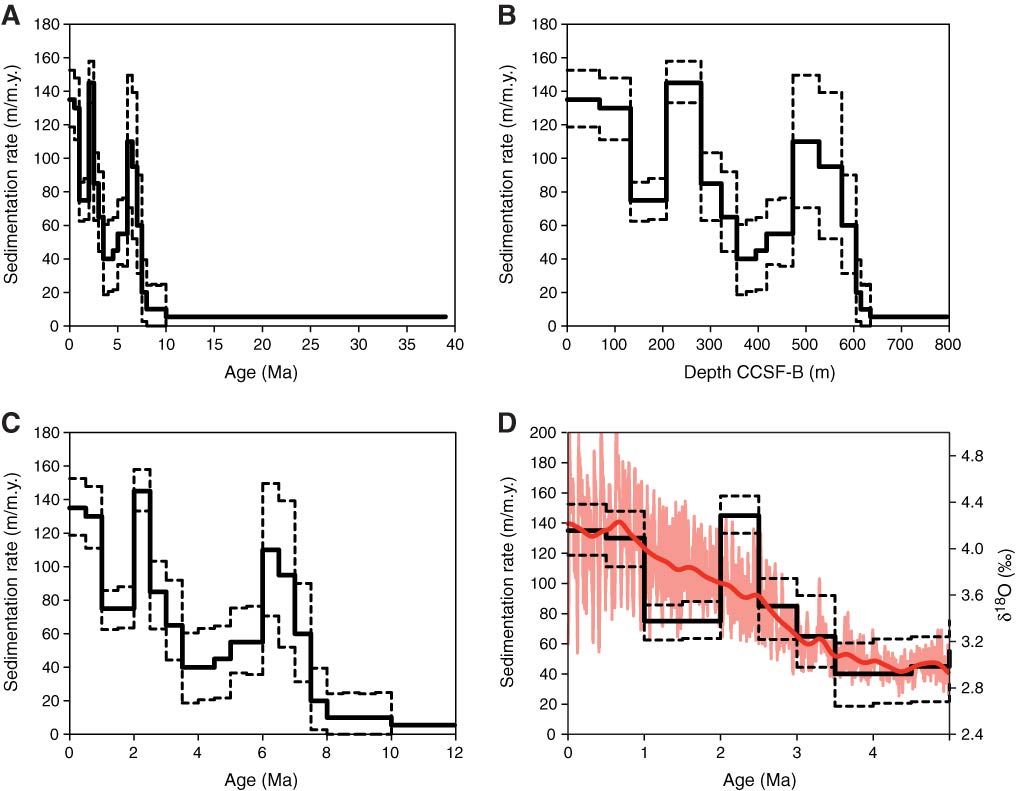
Figure F25. Sedimentation rates estimated based on CCSF-B depth model and shipboard age models, Site U1417. Average sedimentation rates (solid line) are calculated over 0.5 m.y. intervals from 0 to 10 Ma and over a single interval of 10–39 Ma. Uncertainties (+1σ) in sedimentation rate, estimated from 500 iterations of a Monte-Carlo sedimentation model, are bracketed by dashed lines. A. 0–40 Ma. B. Sedimentation rates as a function of m CCSF-B depth. C. 0–12 Ma. D. 0–5 Ma, with sedimentation rates (solid black lines) and uncertainties (dashed black lines) superimposed on the global δ18O stack in pink (data from Lisiecki and Raymo, 2005) with long-term δ18O variations (red line, δ18O data smoothed with a Gaussian filter of 500 ka +3σ width).
Previous | Close | Next | Top of page