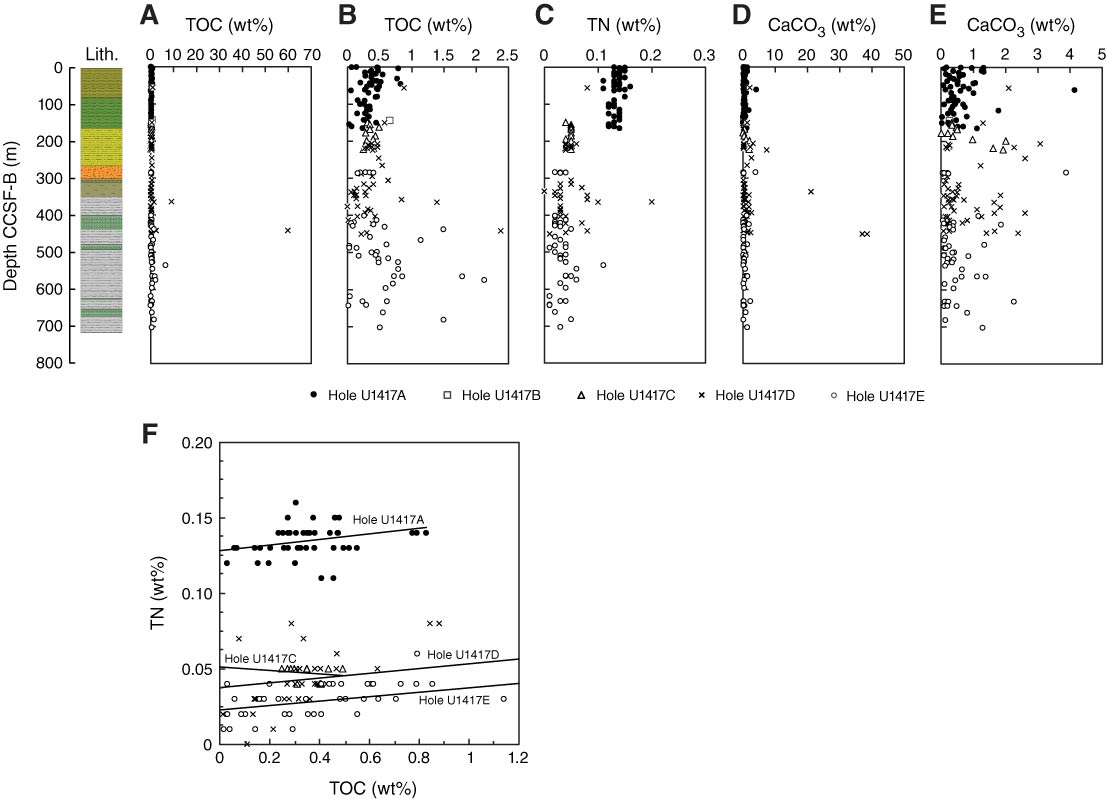
Figure F28. Solid-phase chemical parameters, Site U1417. A. Full range of total organic carbon (TOC) content. B. Subset of TOC content (<2.5 wt%). C. Total nitrogen (TN). D. Full range of CaCO3 content. E. Subset of CaCO3 content (<5 wt%). F. Scatter plot of TOC vs. TN. The potential contribution of inorganic N to the TN signal is estimated where the linear regression line intercepts the y-axis (e.g., Schubert and Calvert, 2001). Full details of Lithology column are shown in Figure F16 (see “Lithostratigraphy”).
Previous | Close | Next | Top of page