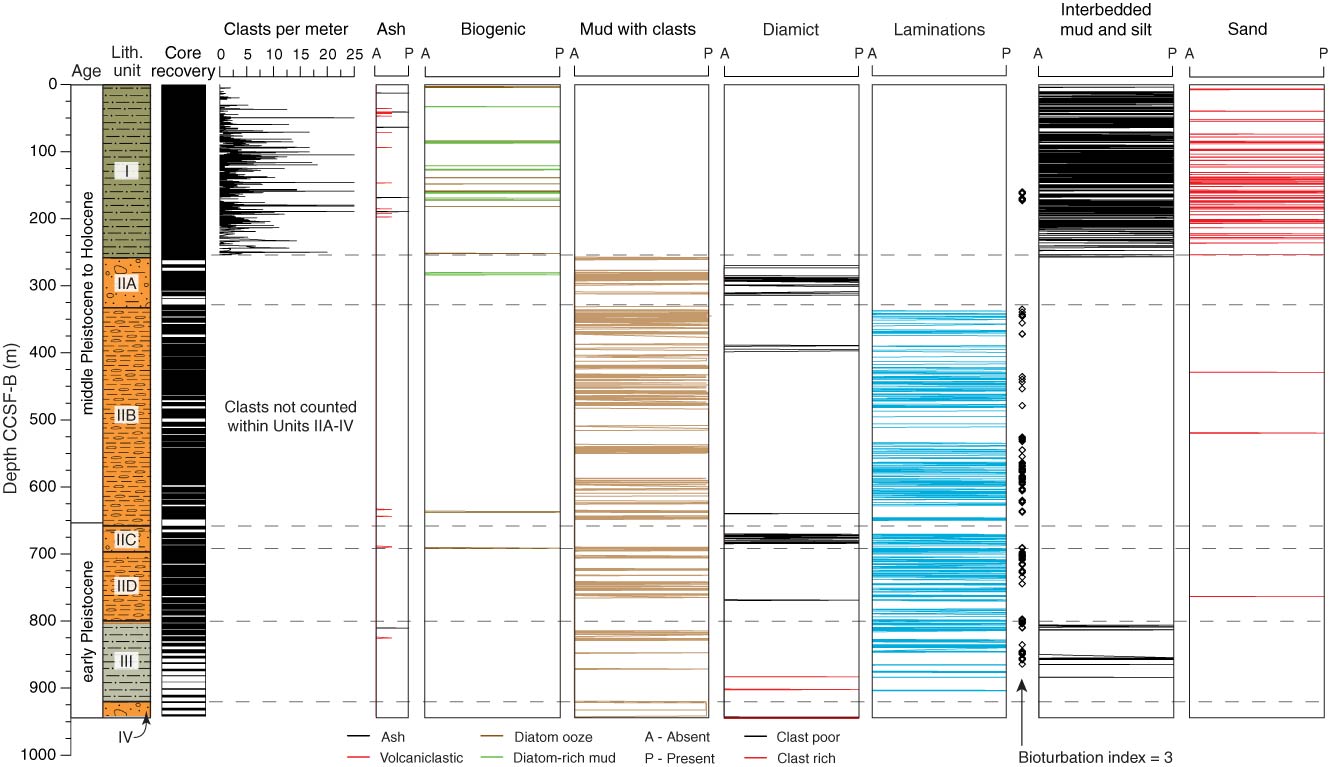
Figure F12. Schematic diagram of lithostratigraphic units and major lithologies, Site U1418. Clasts per meter column shows number of lonestones >2 mm in diameter per meter of section described. For more on the bioturbation intensity index, see the “Methods” chapter (Jaeger et al., 2014a). With the exception of lonestone counts, presence of laminations, and bioturbation index values, downcore profiles represent the occurrence of a described lithologic feature. Data from Holes U1418A and U1418C–U1418F were combined to produce these plots. The early/Middle Pleistocene boundary is placed at the midpoint depth of the Matuyama–Brunhes transition, which occurs close to, but slightly shallower than, the Subunit IIB–IIC transition. Because of the high abundance of clasts in Subunit IIA through Unit IV, individual clasts (>2 mm) were not counted. Horizontal dashed lines denote unit boundaries.
Previous | Close | Next | Top of page