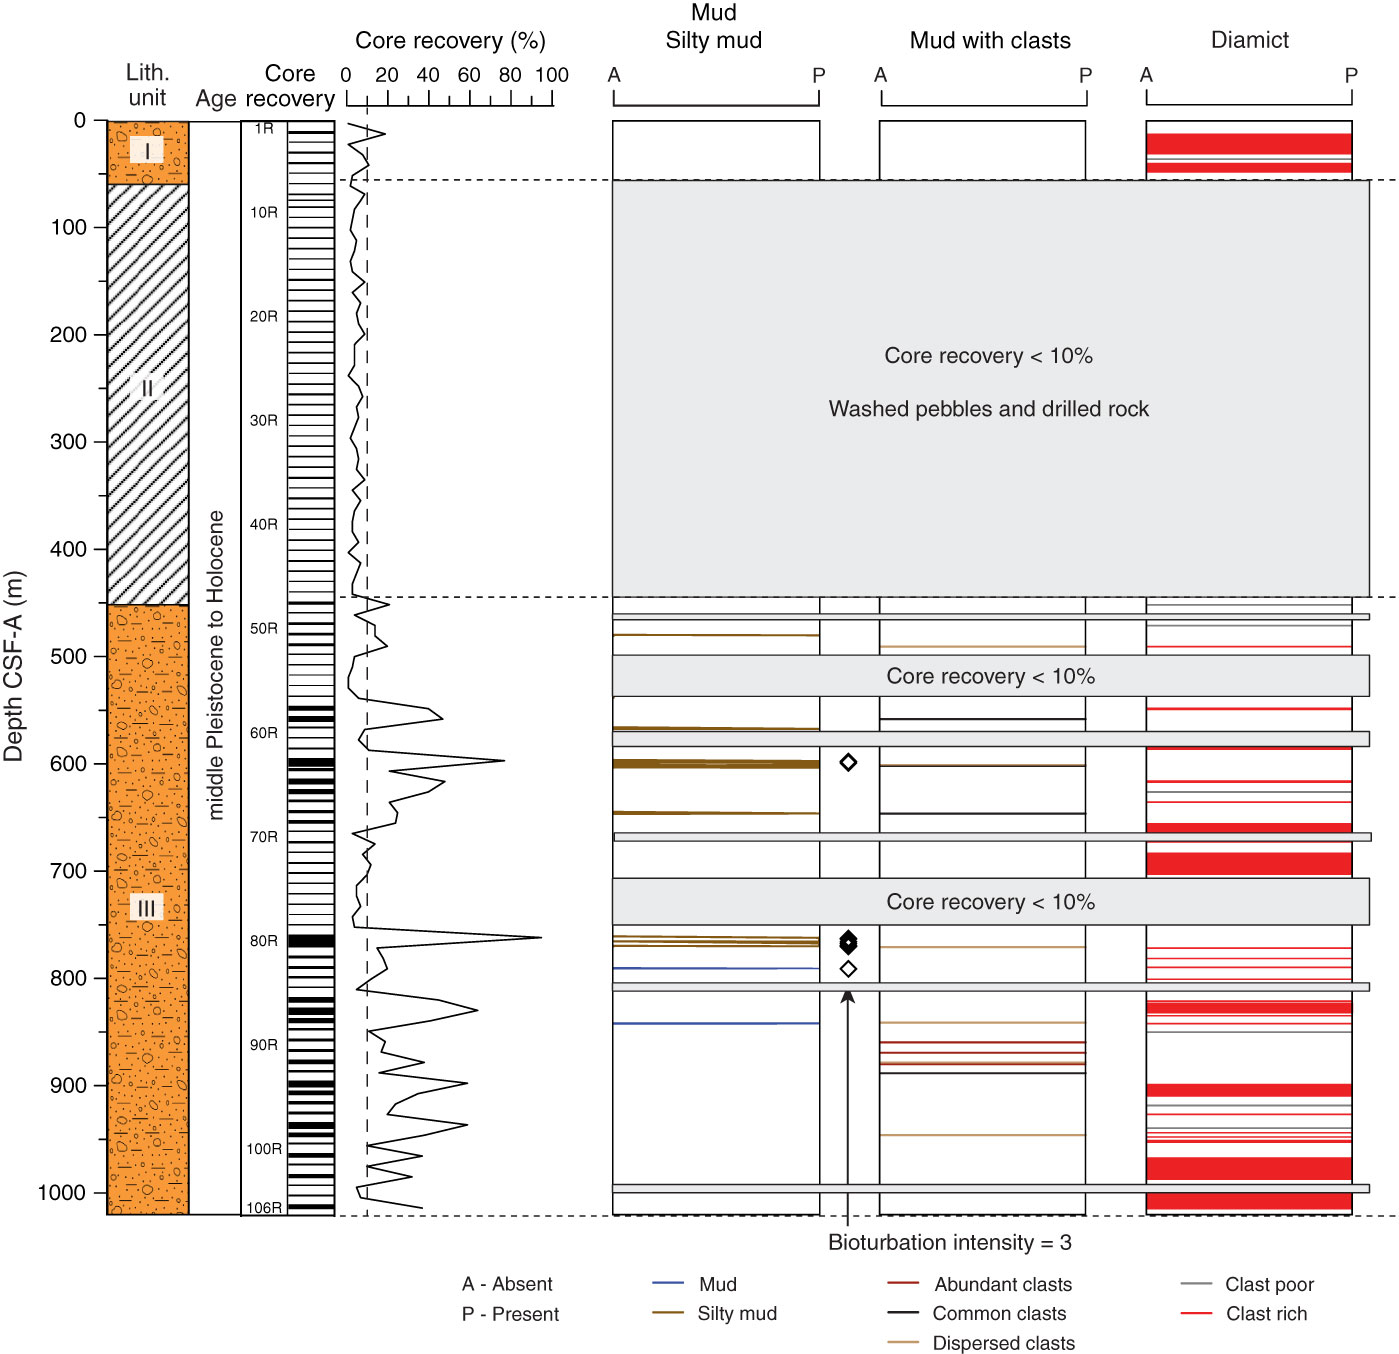
Figure F10. Schematic diagram of lithostratigraphic units and major lithologies, Hole U1420A. Diamonds = intervals of mud or silty mud with high bioturbation. With the exception of core recovery, downcore profiles represent the occurrence of a described lithologic feature. Because of low core recovery (<10%), the distribution of lithostratigraphic units between 60 and 450, 500 and 540, and 710 and 750 m CSF-A is not shown.
Previous | Close | Next | Top of page