Previous | Close | Next
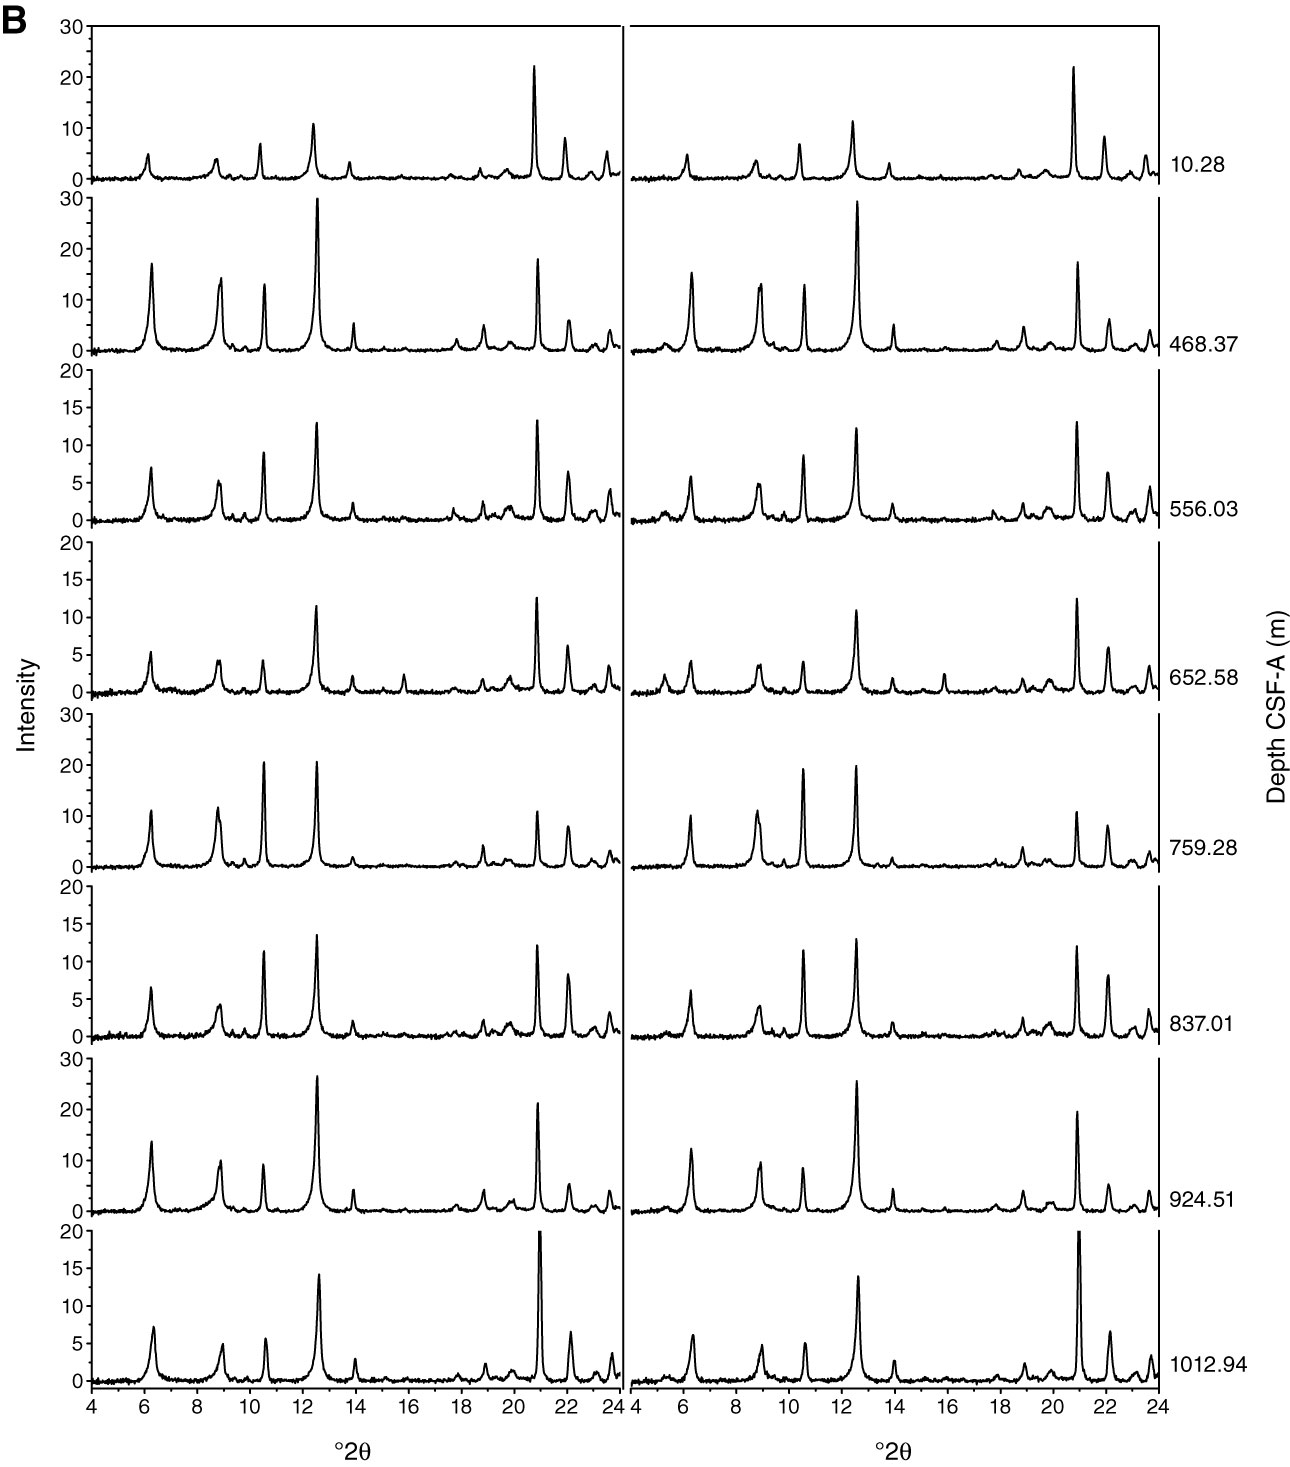
Figure F9 (continued). B. Comparative X-ray diffraction patterns from 4° to 24°2θ. Scans show the downhole samples before (left) and after (right) glycolization treatment.
Previous | Close | Next | Top of page