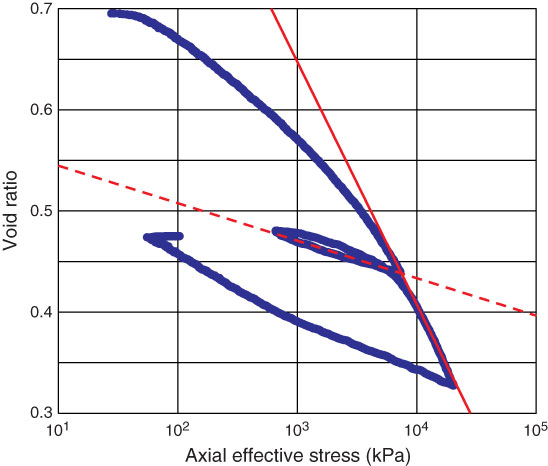
Figure F3. Example e-logσv’ showing determination of Cc and Cs. Data from Sample 341-U1420A-92R-1, 129–133 cm (Test CRS007). Cc was determined as slope of line fit to linear portion of data during virgin consolidation following unload-reload cycle (solid line), Cs was determined as slope of line fit to linear portion of data during reload stage (dashed line).
Previous | Close | Next | Top of page