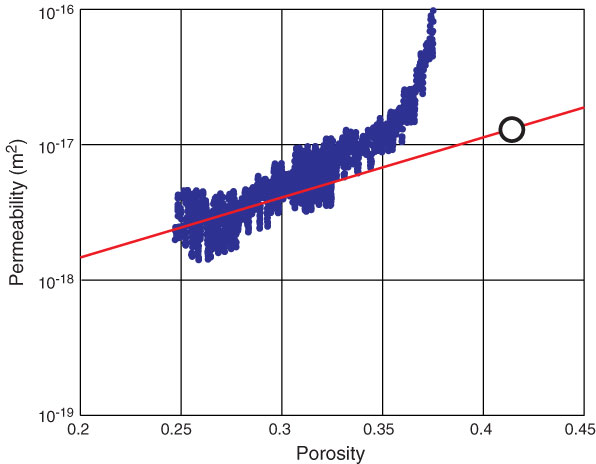
Figure F4. Example of k0 determination. A line is fit to porosity-log(k) data from the virgin consolidation portion of the CRS consolidation experiment (red line). Line is then extrapolated to in situ porosity to determine k0. Data shown are for Sample 341-U1420A-92R-1, 129–133 cm (Test CRS007), with initial porosity of 0.41 and k0 = 1.25 × 10⁻¹⁷ m2 (white circle).
Previous | Close | Next | Top of page