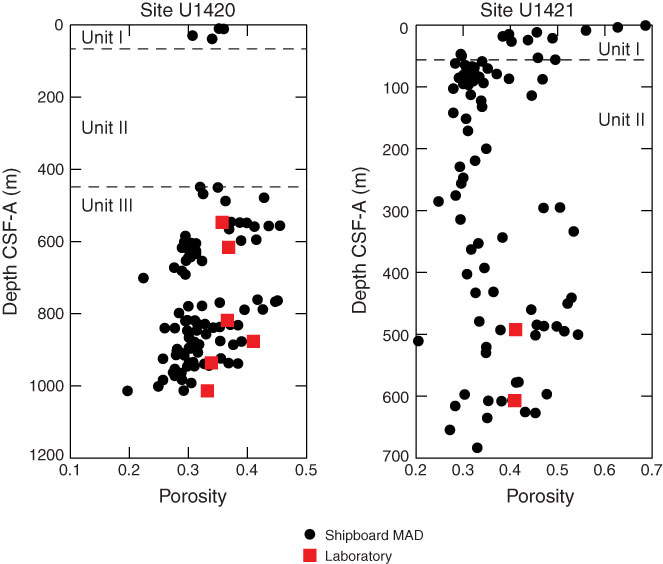
Figure F5. Comparison of shipboard MAD porosity values with those we obtained in the laboratory for Sites U1420 and U1421. Lithologic unit boundaries (see the “Site U1420” and “Site U1421” chapters [Jaeger et al., 2014b, 2014c]) are shown for reference.
Previous | Close | Next | Top of page