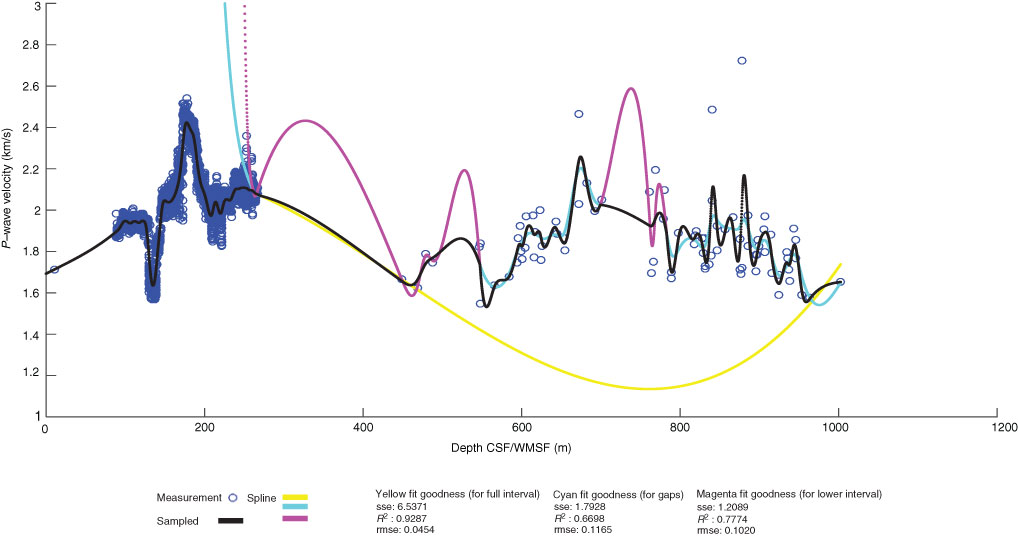
Figure F6. Compressional wave velocity measurements compilation and spline fits, Site U1420. The final sampled curve is at a rate of 0.1524 m. Goodness of fit characteristics are reported in the figure for data included in the compilation within respective intervals. In the upper interval, ~270 m, the yellow aggressively fitted curve was sampled. Deeper than 270 m on the combined depth scale, we sampled either the smoothed cyan curve for the poorly constrained intervals or the magenta curve, which we fitted aggressively for comparatively well constrained intervals. sse = sum of squared errors, rmse = root mean squared error.
Previous | Close | Next | Top of page