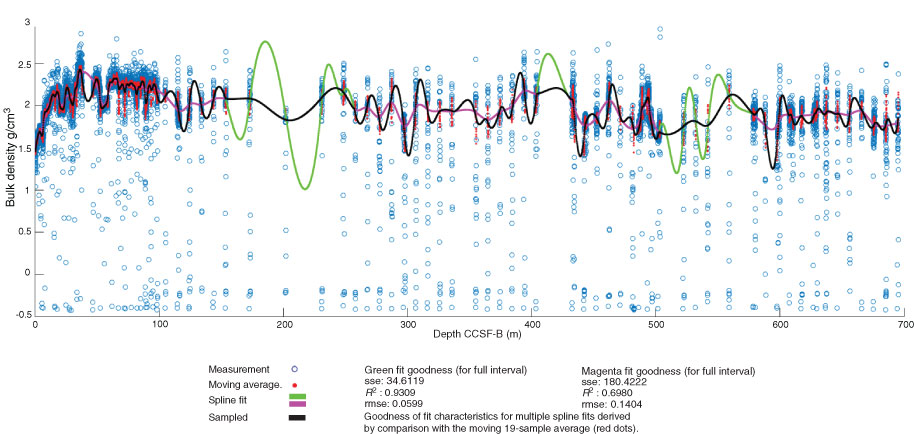
Figure F7. Bulk density compilation and fits, Site U1421. The final curve (black) was sampled at a rate of 0.1524 m. We selected the green fit for the compilation because it had the highest R2 value such that the minimum density prediction was 1 g/cm3. For intervals near 180–220, 400–420, and 500–580 m CCSF-B, we sampled a spline fitted more conservatively for the whole data set (magenta). Measurements shown before outlier removal.
Previous | Close | Next | Top of page