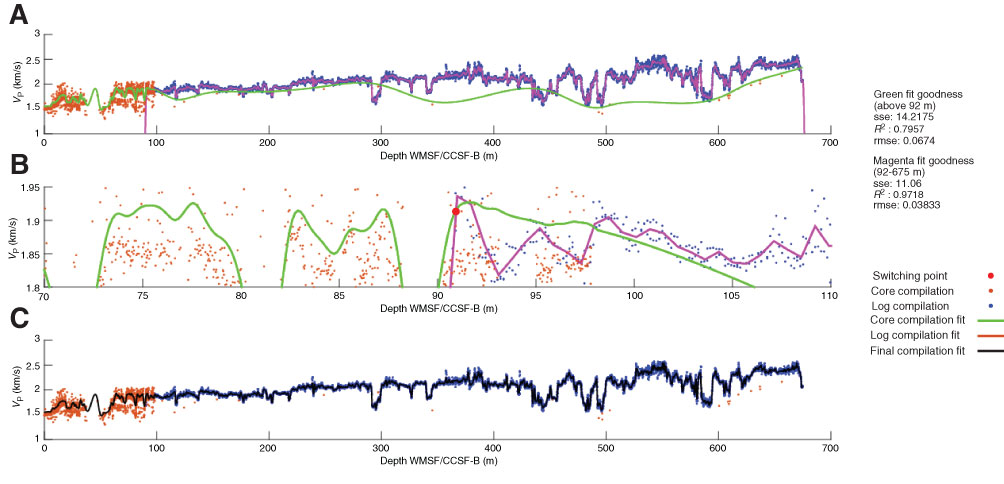
Figure F8. A. Compressional wave velocity data compilation, Site U1421. Core data and in situ logging measurements were fitted independently with two splines. B. Detail of the overlapping interval shows intersection point of the core-fitted and log-fitted splines selected to splice the curves together such that use of the logging data was prioritized. C. Final sampled curve for the full interval with core data and logging data.
Previous | Close | Next | Top of page