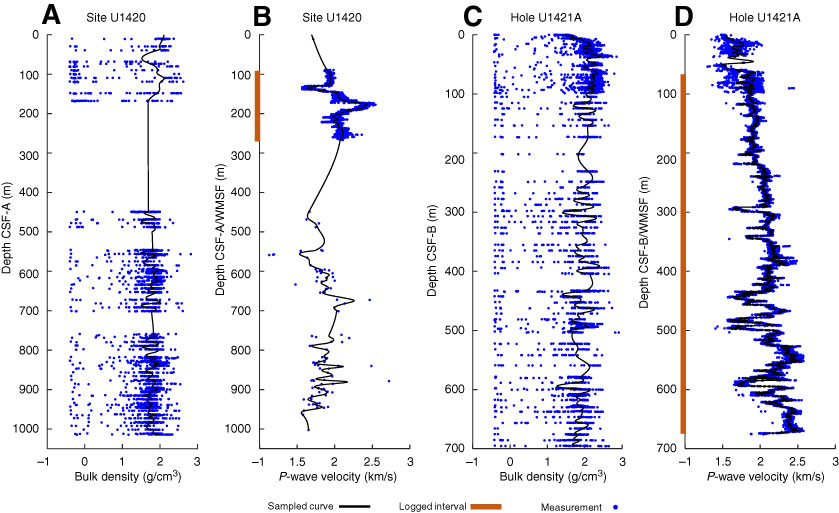
Figure F9. A. Original bulk density WRMSL data set and fit for Site U1420 shown with interpolated physical property curve sampled at 0.1524 m spacing. B. Compressional wave velocity compilation from sonic log and PWC core-derived measurements, Site U1420. Interpolated physical property curve sampled at 0.1524 m interval and fitted as described in the text. C. Original bulk density WRMSL and STMSL data set compilation and fit for Hole U1421A shown with interpolated physical property curve sampled at 0.1524 m spacing. D. Compressional wave velocity compilation from sonic log and PWC core-derived measurements, Hole U1421A. Interpolated physical property curve sampled at 0.1524 m interval and fitted as described in the text.
Previous | Close | Next | Top of page