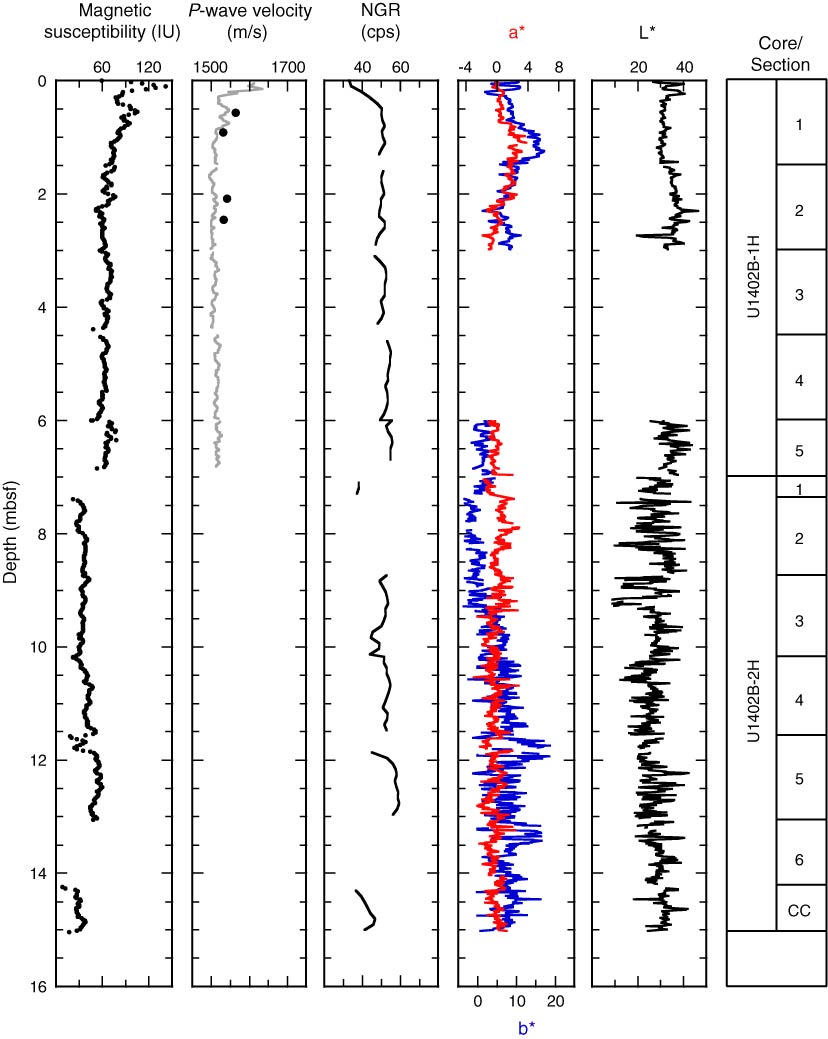
Figure F10. Plots of magnetic susceptibility, P-wave velocity (gray line = P-wave logger data from whole-round sections, black circles = discrete measurements from working section halves), natural gamma radiation (NGR), and color reflectance (L*, a*, b*), Hole U1402B.
Previous | Close | Next | Top of page