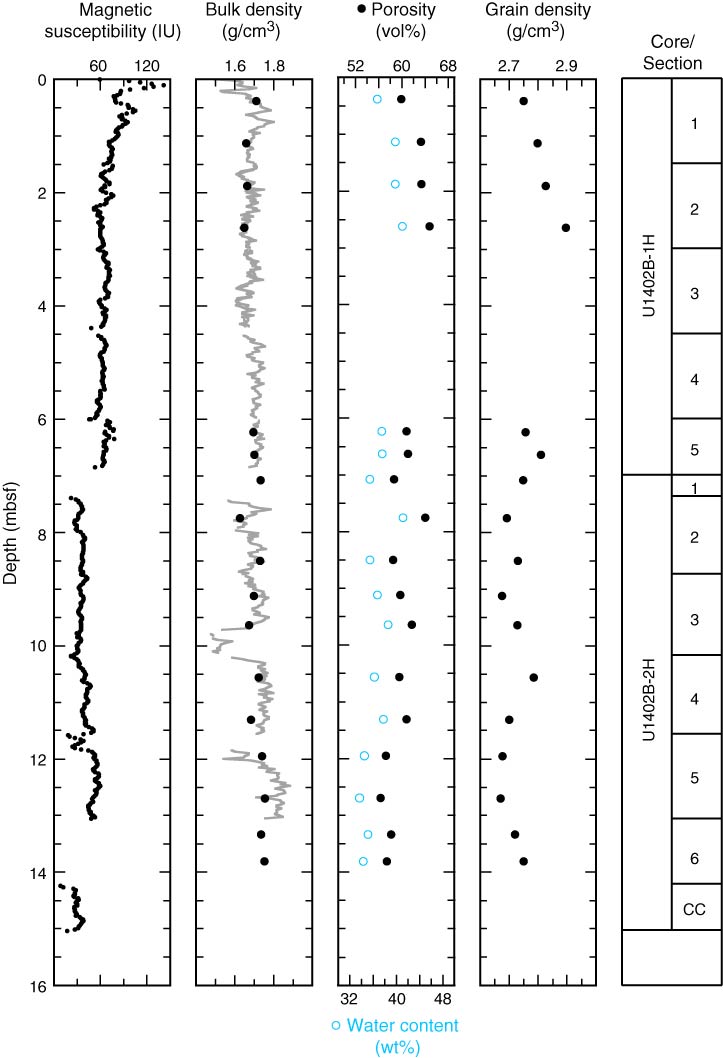
Figure F9. Plots of magnetic susceptibility, bulk density (gray line = gamma ray attenuation bulk density from whole-round sections, black circles = moisture and density bulk density from discrete samples), porosity, water content, and grain density, Hole U1402B.
Previous | Close | Next | Top of page