Previous | Close | Next
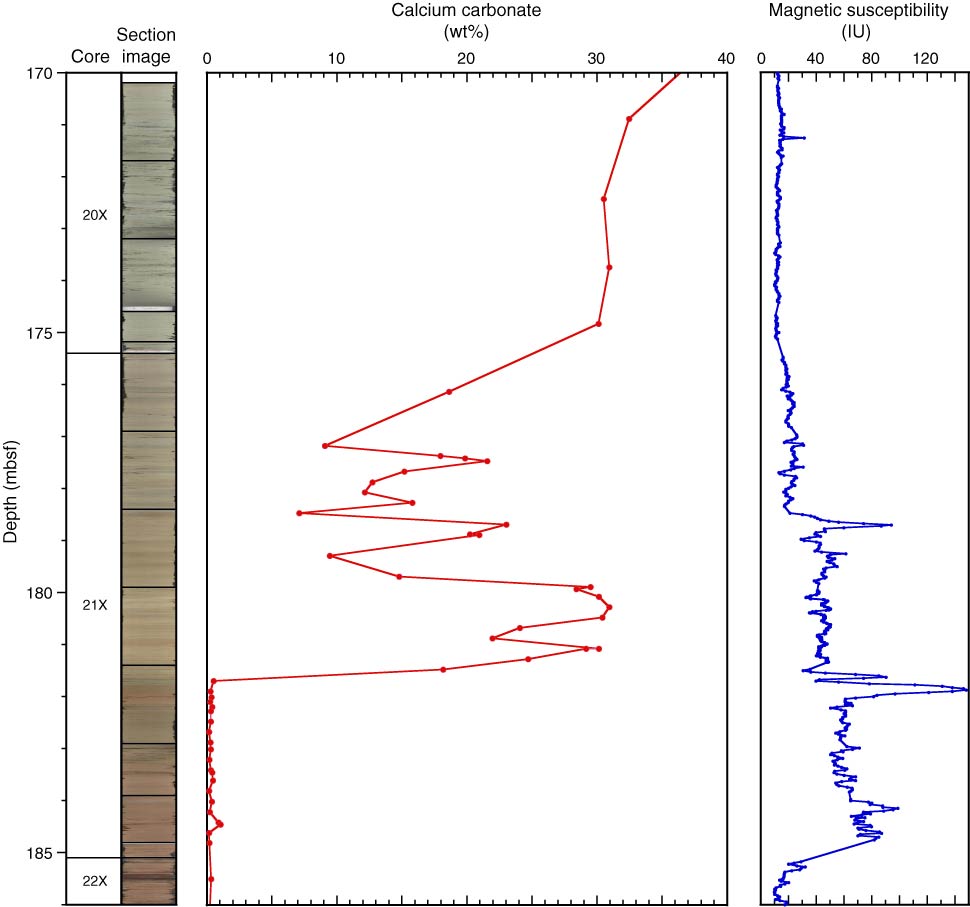
Figure F27. Plot of carbonate content in the interval corresponding to the Paleocene/Eocene Thermal Maximum, Core 342-U1403A-21X.
Previous | Close | Next | Top of page