Previous | Close | Next
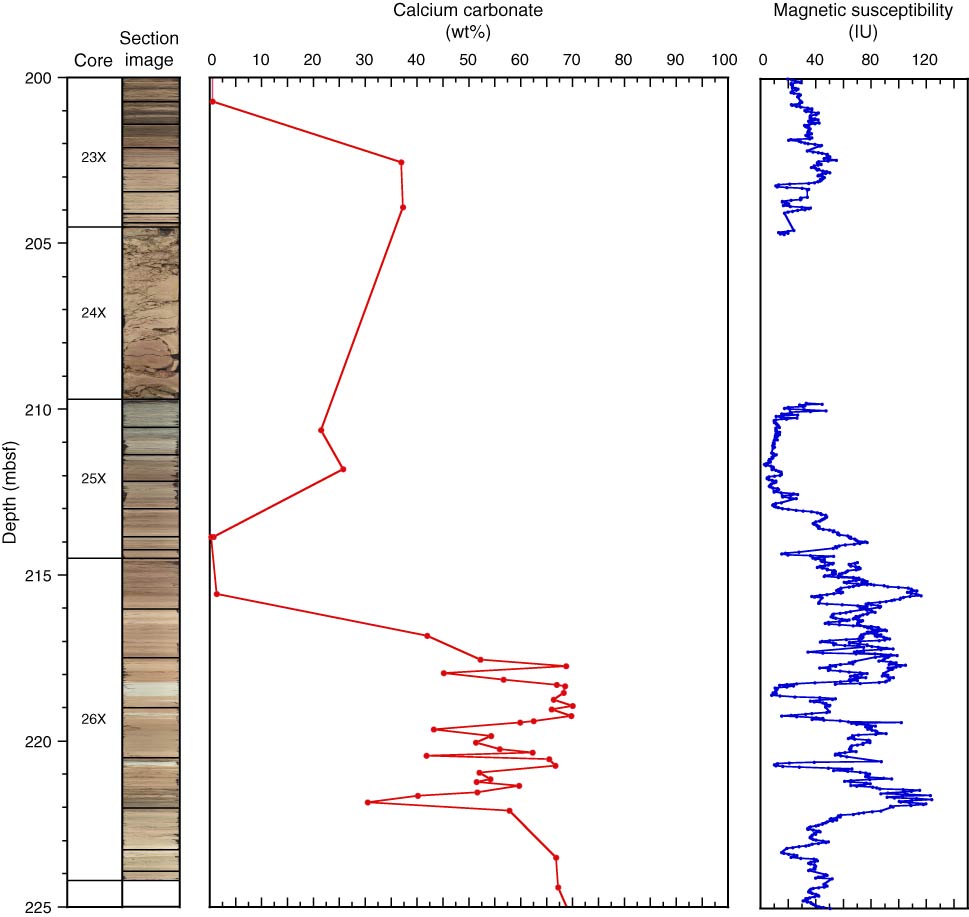
Figure F28. Plot of carbonate content and magnetic susceptibility in the interval corresponding to the Cretaceous/Paleogene boundary, Core 342-U1403A-26X.
Previous | Close | Next | Top of page