Previous | Close | Next
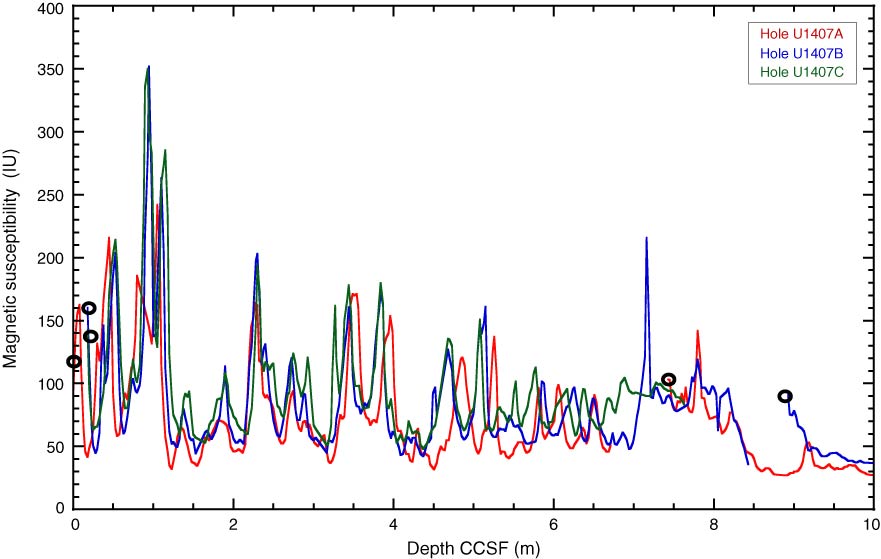
Figure F39. Plot of magnetic susceptibility data from 0–10 m CCSF, Site U1407. Note the large-amplitude cycles in magnetic susceptibility in Pleistocene lithostratigraphic Unit I.
Previous | Close | Next | Top of page