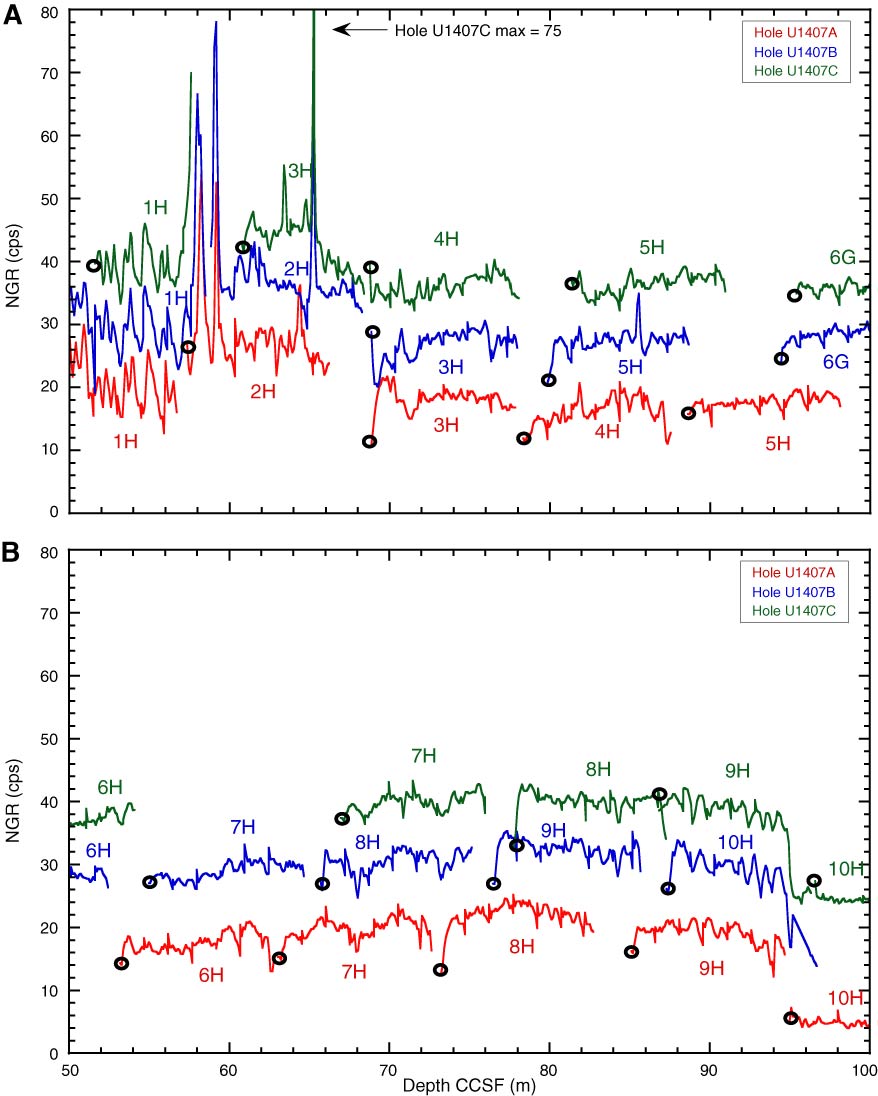
Figure F40. Plots of natural gamma radiation (NGR) data, Site U1407. Data from Holes U1407B and U1407C are offset by 10 and 20 cps, respectively, to aid visualization. Open circles indicate core tops. A. 0–50 m CCSF. B. 50–100 m CCSF. (Continued on next three pages.)
Previous | Close | Next | Top of page