Previous | Close | Next
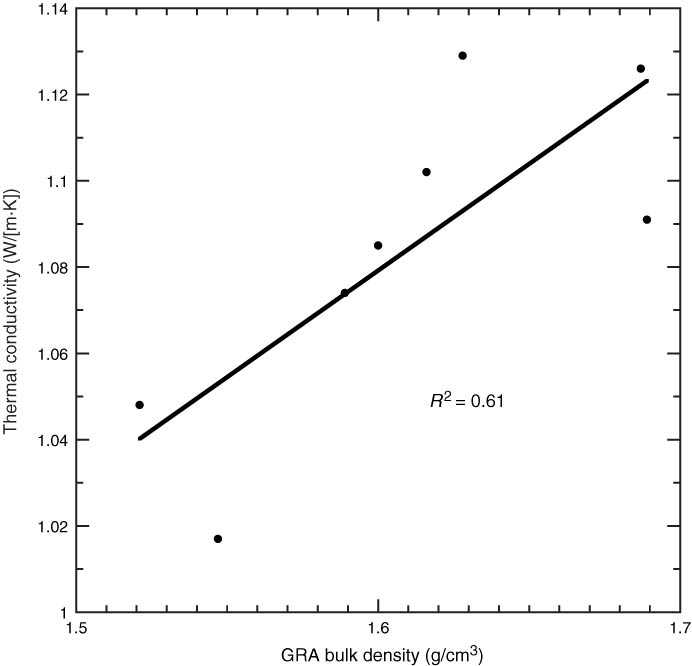
Figure F33. Plot of thermal conductivity vs. gamma ray attenuation (GRA) bulk density, Hole U1408A. Black line is the linear-curve fit for this data set, and R2 is the correlation coefficient.
Previous | Close | Next | Top of page