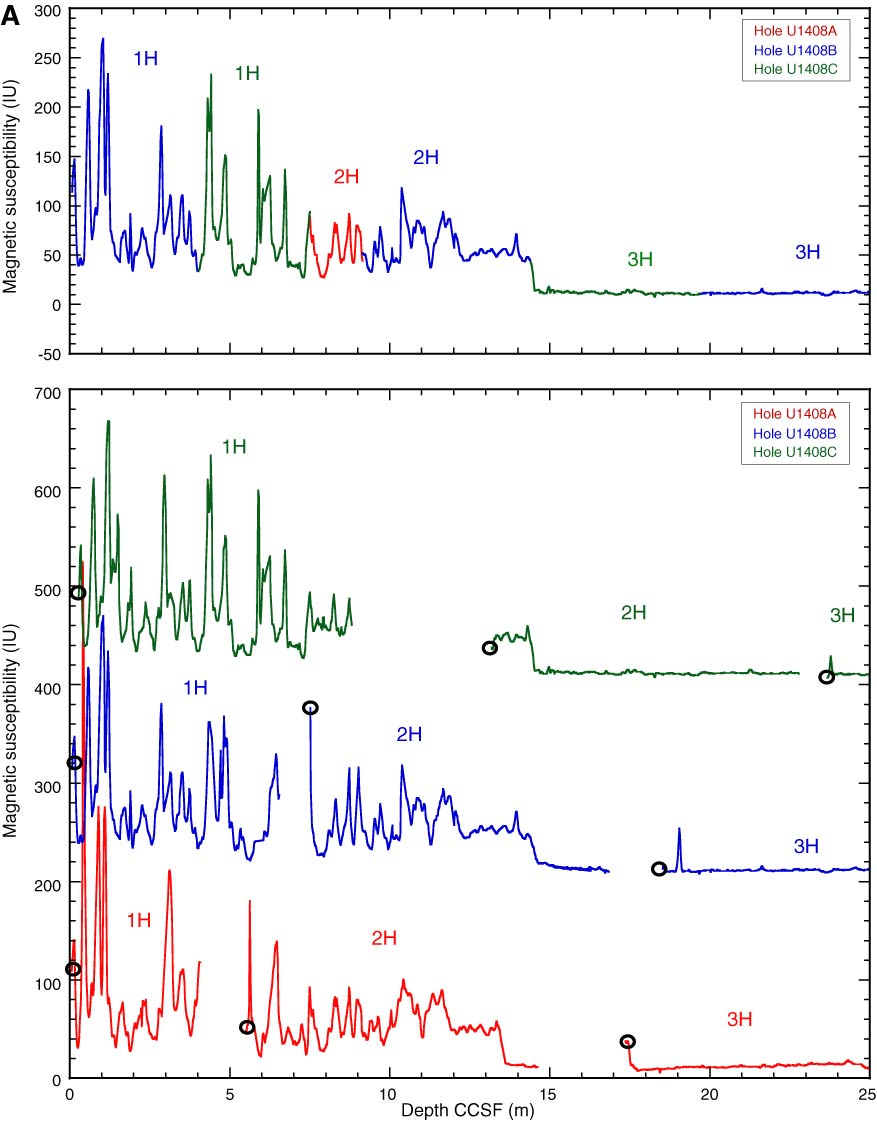
Figure F34. Plots of magnetic susceptibility data, Site U1408. Top panels show the spliced section for each interval of the splice. Bottom panels show complete magnetic susceptibility records. Open circles indicate core tops, excluding culled data from disturbed intervals. A. 0–25 m CCSF. Data for Holes U1408B and U1408C are offset by 200 and 400 IU, respectively, to aid visualization. (Continued on next five pages.)
Previous | Close | Next | Top of page