Previous | Close | Next
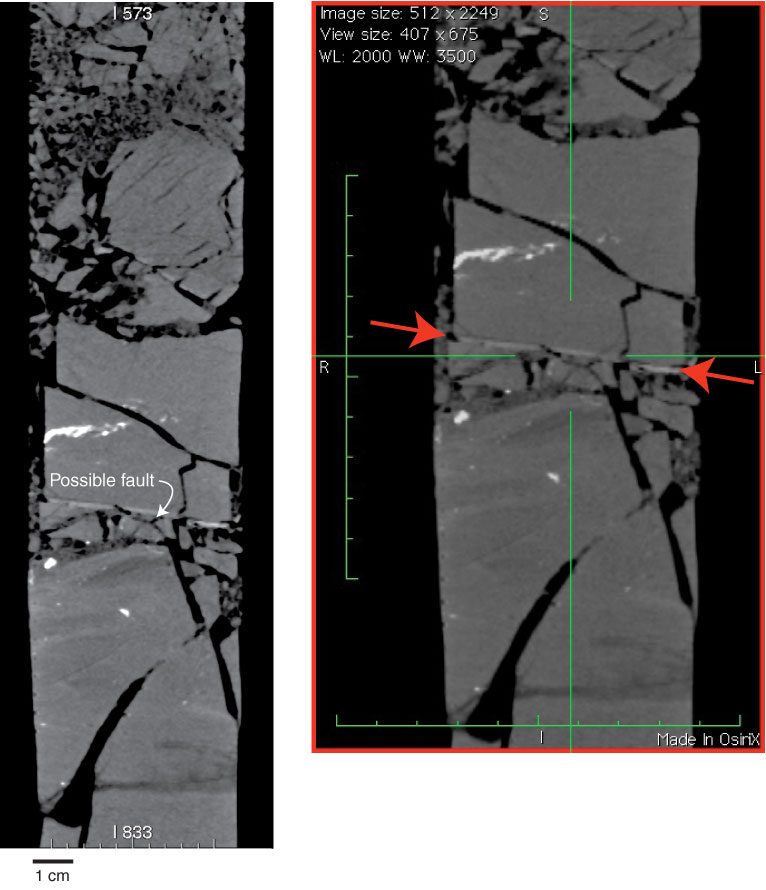
Figure F36. The bright band in X-ray CT image in Section 343-C0019E-5R-1, close to the location of pore water and H2 gas anomalies at 698 mbsf.
Previous | Close | Next | Top of page