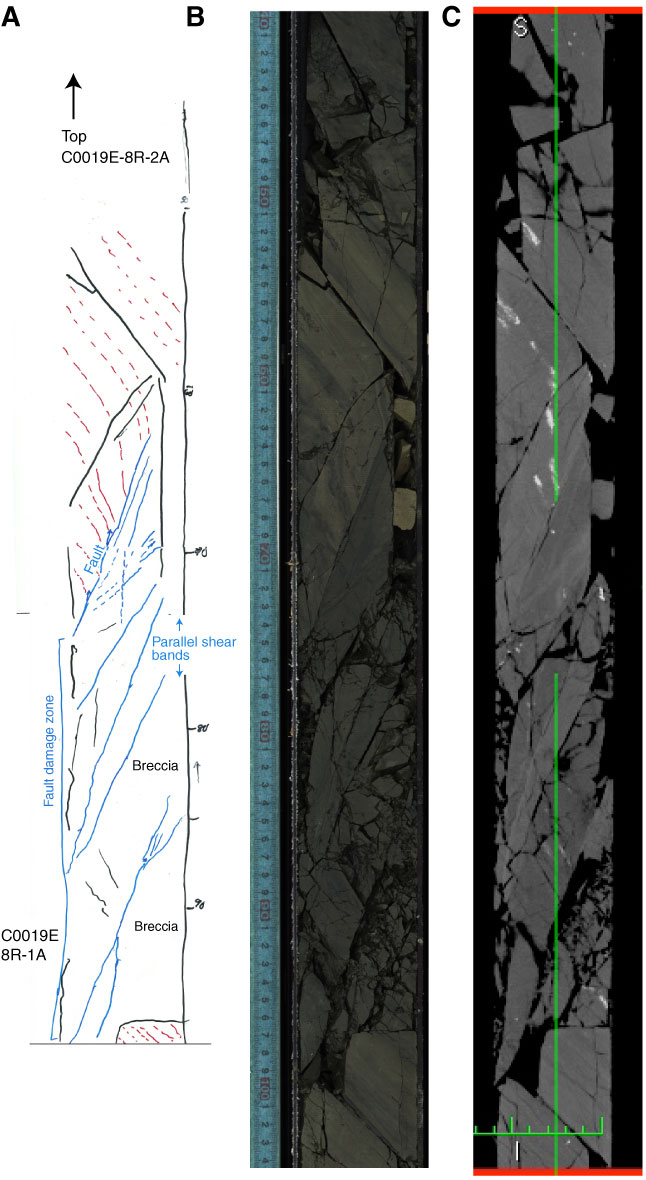
Figure F37. X-ray CT and core images of a 60°-dipping, 15 cm thick zone of anastomosing shear surfaces and deformed rock across which bedding dip changes (located 60–95 cm from the top of Section 343-C0019E-8R-1). A. Structure tracing scan. Red lines = bedding, blue lines = fractures, black lines = drilling induced damage. B. MSCL-I image. C. X-ray CT image of coronal section. Note the darker band dipping ~60° to the left in the image in the interval 60–95 cm from the section top.
Previous | Close | Next | Top of page