Previous | Close | Next
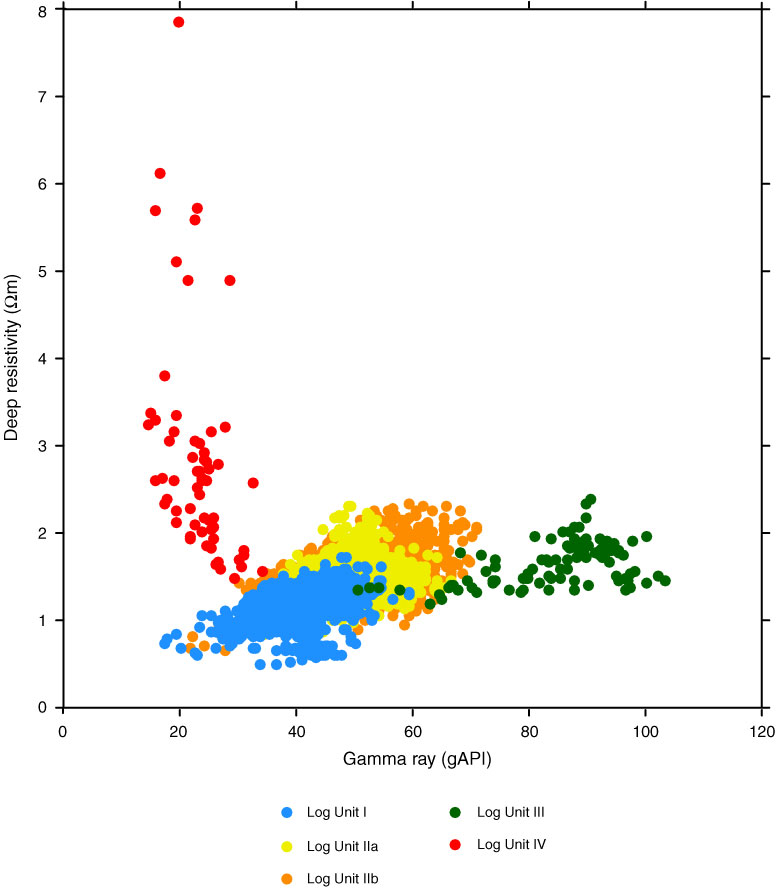
Figure F6. Cross-plot of deep button resistivity and gamma ray showing the distribution of each of the defined log units, Hole C0019B.
Previous | Close | Next | Top of page