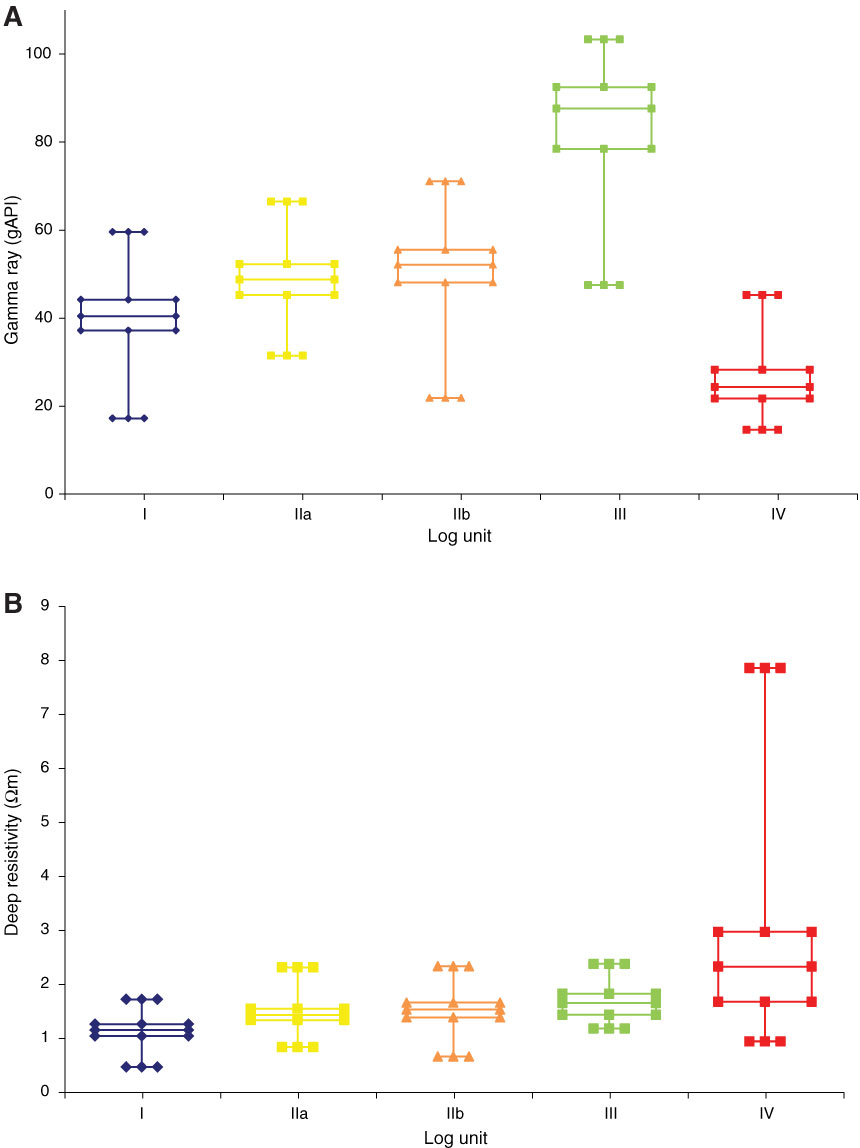
Figure F7. Box and whisker plots showing the (A) gamma ray and (B) deep resistivity value ranges for each of the defined log units, Hole C0019B. Box and whisker plots comprise the minimum, 25 percentile, median, 75 percentile, and maximum values.
Previous | Close | Next | Top of page