Previous | Close | Next
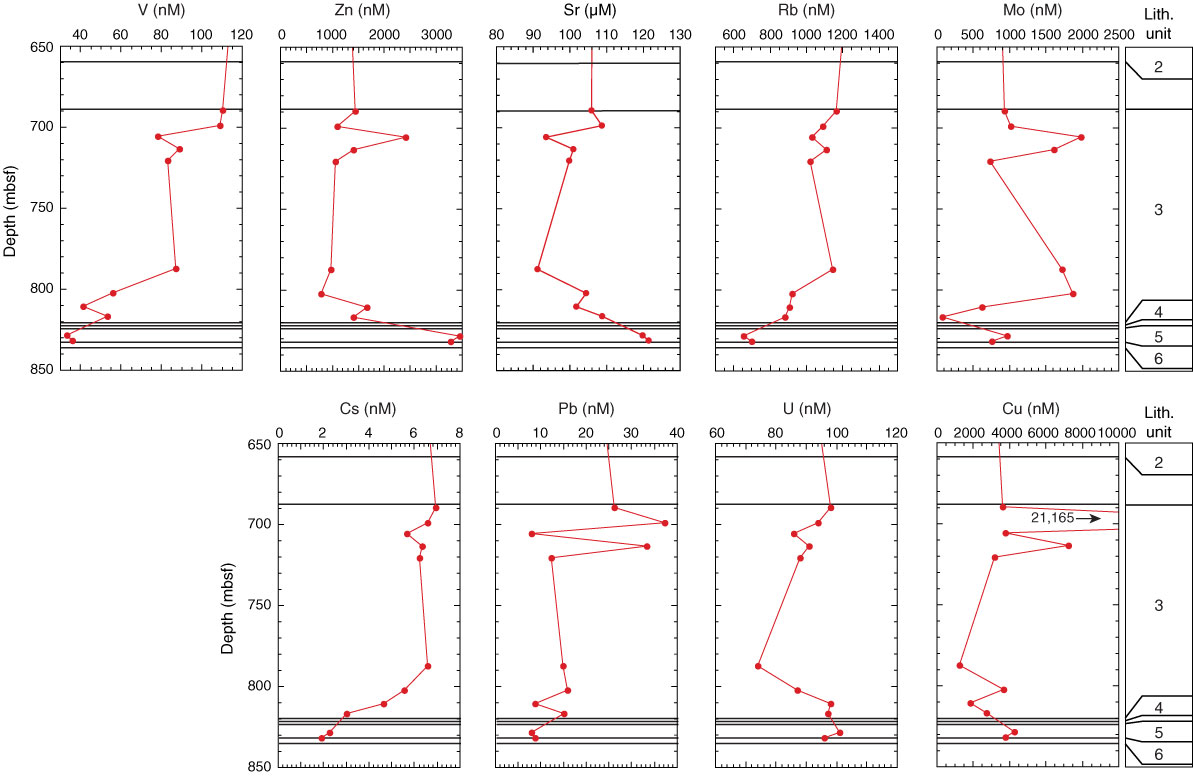
Figure F61. Plots of depth profiles of vanadium, zinc, strontium, rubidium, molybdenum, cesium, lead, uranium, and copper, Site C0019. Plots represent data summarized in Table T10.
Previous | Close | Next | Top of page