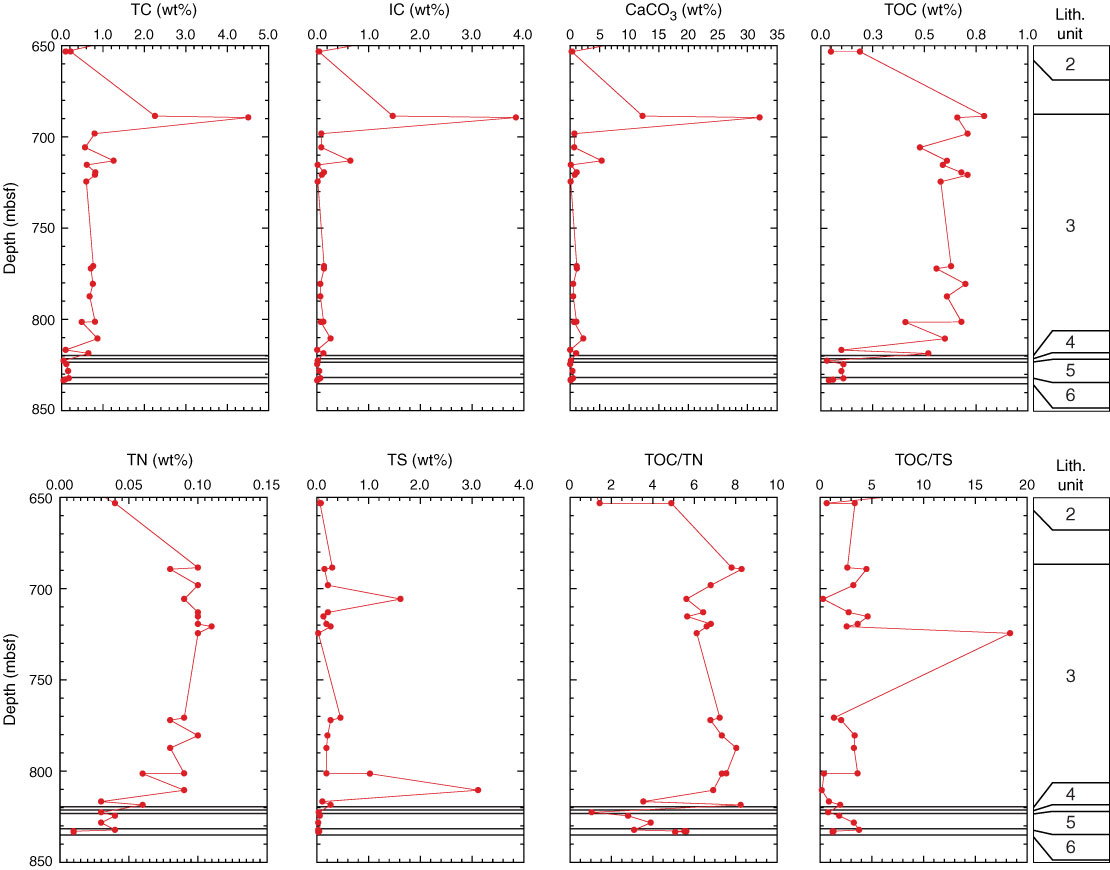
Figure F62. Plots of depth profiles of total carbon (TC), inorganic carbon (IC), calcium carbonate (CaCO3), total organic carbon (TOC), total nitrogen (TN), total sulfur (TS), TOC/TN ratio, and TOC/TS ratio, Site C0019. Depth intervals of lithologic Units 2–6 are shown on the right.

Previous | Close | Next | Top of page